We advance social progress driven by a firm commitment to our employees, whose talent, effort and dedication are the motivating force behind our positive community impact.
OUR ROADMAP. GRIFOLS AGENDA 2030
- More training: increase annual training hours per employee
- Organization-wide training: boost the percentage of employees who take part in training activities
- Shared responsibility: increase the number of women in Grifols senior management
- Integration: incorporate more people with disabilities into the talent pool
- Equality: ensure an equal number of male and female candidates in internal promotion processes for managerial roles
- Employee turnover: decrease the overall rate below to the industry average
- Company commitment: increase the engagement rate per department
- Employee health and well-being: increase the number of Grifols organizations certified as “Healthy Company”
- Efficiency: reduce lost time injury frequency rate (LTIFR))
- Occupational health and safety: increase number of ISO 45001-certified work centers
- Expand social outreach and community investments
- Increase social investments in STEM scholarships for women
- More product and medical donations for emergency situations
- Boost investment allocation in the José Antonio Grifols Lucas Foundation
- Increase investment and scholarship funds for the Victor Grifols i Lucas Foundation
RECOGNITION AND PRESENCE IN INDEXES
TOP THREE PRIORITIES
OUR PEOPLE
Promote ongoing
training, learning and talent
development opportunities;
advance inclusion and diversity
efforts; create safe and healthy
work environments
HEALTH SYSTEMS
Contribute to making global
healthcare systems more
sustainable and accessible
COMMUNITY
Elevate the multiplier effect
of our activity in terms of job
creation, socioeconomic impact
and social benefits, among
other areas
People management at Grifols
Grounded on solid principles


We adhere to UN Global Compact labor principles
PRINCIPLE 3
We uphold the freedom of association and the effective recognition of the right to collective bargaining
PRINCIPLE 4
We support the elimination of all forms of forced and compulsory labor
PRINCIPLE 5
We support the effective abolition of child labor
PRINCIPLE 6
We support the elimination of discrimination in respect of employment and occupation
Policies, guidelines and management tools
- Global Recruitment and Selection Policy: guarantees a systematic approach to recruitment, legal compliance and alignment with corporate values to ensure zero discrimination in the recruitment process based on age, marital status, disability, gender, family status, race, religion or sexual orientation.
- Occupational Health and Safety Policy: focuses on the ongoing application of rigorous health, safety and risk-prevention criteria in the workplace, ensuring the active participation and fluid communication with all stakeholders.
- Mental Health Policy: designed to prevent, protect and promote employee mental health and well-being, as well as support workers dealing with mental health issues. Grifols will conduct an organization-wide employee survey in the first quarter of 2024.
- Global Diversity and Inclusion Policy: recognizes and values the contribution of people with different abilities, experiences and perspectives.
- Harassment Prevention Policy: defines harassment as a form of discrimination and defines the types of behavior explicitly prohibited by the organization, underlining its commitment to providing a harassment-free workplace.
- Global Training Policy: establishes training commitments and responsibilities, and offers a framework to develop and implement strategic and long-term employee development plans.
- "Flexibility for U" Policy: extensive to all Grifols employees, it defines the criteria for remote work, additional flexibility measures and best practices in digital disconnection to promote better work-life balance.
- Corporate Internship Policy: establishes and regulates the procedures and benefits for student interns at Grifols’ Spanish installations.
- Grifols Performance System (GPS): annual assessment to ensure managers provide employees with adequate feedback on their professional performance and conduct, including core strengths and areas for improvement.
Employee policies are publicly available at www.grifols.com
More information on the "Grifols Performance System" section.
Our employee commitments
Grifols strives to promote equal opportunities, a diverse and inclusive talent pool, and the professional development of its employees. The company articulates this organization-wide commitment through a range policies, guidelines and other management tools reflect this organization-wide employee commitment.
8 commitments
- Act in a responsible and sustainable manner while engaging Grifols teams
- Uphold diversity, inclusion and equal opportunity
- Ensure occupational health, wellness and safety
- Maintain open lines of communication
- Drive innovation by working as a team
- Offer training adapted to each employee
- Support a professional development model that detects both strengths and areas for growth
- Guarantee competitive compensation packages
Priorities in 2023
- Continue to address the needs detected in the most recent global employee survey (2020) and Engagement Pulse Survey (2023).
- Boost competitiveness through the "Caring for You" program, designed for the entire Grifols workforce.
- Encourage employee development through online or in-person training or learning opportunities.
- Enhance employee experience to attract and retain the best talent while advancing in diversity, equality, inclusion and wellness, driven by a recently implemented wellness plan (2023), a U.S. and Spain-based engagement program and other actions.
4 core projects

- Trust and flexibility to continue promoting an optimal work-life balance

- Emphasis on the health and well-being of our employee

- Program to recognize top contributors launched in 2022

- Development initiatives with a long-term vision
These programs are described in greater detail later in the chapter.
We grow alongside our team
Global workforce*:
23.741
58% women
42% men
Grifols: 21,144 employees
Biotest: 2,597 employees
(53% women – 47% men)
*Total employee pool including Grifols and Biotest
Committed to job creation
6,246
employees
99% permanent contracts
52% of employees are 30-50 years old
We promote equality**
63%+ promotions correspond to women
67% of new hires are women
41% of directors are women: 172
47% of managers are women: 595
One of the world’s best workplaces for women according to Forbes
** Biotest not included – increase in relation to 2021
We promote diversity
92
nationalities
Promoting minorities in the U.S.
+African American:
21% in 2023
22,3% in 2022
+ Hispanic:
25% in 2023
23.2% in 2022
Recognized as a leading supporter of Hispanics by the Hispanic-Latino Professionals Association 2023
Spain and ROW
3.7% of our workforce is composed by people with disabilities
More details on Grifols’ employee pool is available at the end of the chapter.
Grifols’ workforce in 2023
At December 31, 2023, Grifols’ employee pool (including Biotest) stood at 23,741 people, denoting a 10% year-on-year decline. This decrease forms part of the company’s operational improvement plan, announced in the first quarter of 2023. In this regard, the company expressed its intention to promote open dialogue and positive negotiations, as well as prioritize reorganization and hiring freezes to minimize the impact on employees.
In 2023, the firm’s workforce fell by 1% in Spain to 4,181 people and by 17% in the Unites States to 13,918 people, while increasing by 2% in the rest of the world, including Biotest.
On March 31, Grifols’ labor force reduction plan (ERE, expediente de regulación de empleo) came to an end. The company reduced the number of affected people to 51 following fruitful discussions with employees’ legal representatives.
In the U.S., the company carried out an employment optimization plan to boost efficiency in its plasma donation centers. Approximately 2,000 U.S. employees were affected under the plan, which also entailed the reduction of managerial positions from seven to four categories, outplacement services and additional employee benefits.
In times of change, we remain committed to our employees
As part of its operational improvement plan, Grifols adopted several measures to optimize plasma costs and operations, streamline corporate functions, and modify its organizational structure that impacted its employee pool. While faced with difficult decisions, the company made it a priority to help affected employees successfully transition to new employment opportunities, as well as provide them emotional and professional support.
As part of these efforts, Grifols offered personalized counseling and outplacement services with training sessions on interview techniques, salary negotiation, professional development and other competencies.
Diversity and inclusion
Grifols made significant strides on its Strategic Diversity and Inclusion Plan in 2023. Implemented in 2021, the plan includes development and awareness activities to promote gender equality, the inclusion of people with disabilities and the representation of minorities, as well as a multicultural and multigenerational workforce.
For Grifols, diversity is a core engine in driving innovation and developing new ideas as evidenced in the three core objectives of its Diversity and Inclusion Policy:
- Reflect the diversity in Grifols’ communities of operation.
- Continuously foster diversity and inclusion in Grifols’ corporate culture.
- Position Grifols as a global benchmark of diversity and inclusion.
In 2023, Grifols introduced the option of including gender pronouns in its corporate email signatures. Gender options were also expanded on job applications, which now include male, female, non-binary or non-declared options. In celebration of International LGBTIQ+ Pride Day, the company imparted training sessions in the U.S. and Spain on the importance of inclusive language, with the participations of over 500 employees.
Taking pride in our diverse workforce
Grifols continued its efforts to increase ethic representation in its U.S. workforce. Globally, it enhanced its international communications to provide greater visibility for celebrations such as Black History Month, Hispanic Heritage Month, Veteran’s Day, International Day of Persons with Disabilities (global), International Women’s Day (global) and International LGBTIQ+ Pride Day.
| FOCUS | ACTIONS | |||
| U.S. | Spain + ROW | |||
| 2021 | Increase the representation of minorities | Bolster inclusion of people with disabilities |
|
|
| 2022 | Promote intergenerational work values | Promote intergenerational work values |
|
|
| 2023 | Bolster inclusion of people with disabilities | Promote interculturality |
Interculturality
Disability Spain:
U.S.:
|
|
Diversity in Grifols
| GRIFOLS | BIOTEST | ||||
| 2023 | 2022 | 2021 | 2023 | 2022 | |
| Number of nationalities | 92 | 94 | 98 | 56 | 48 |
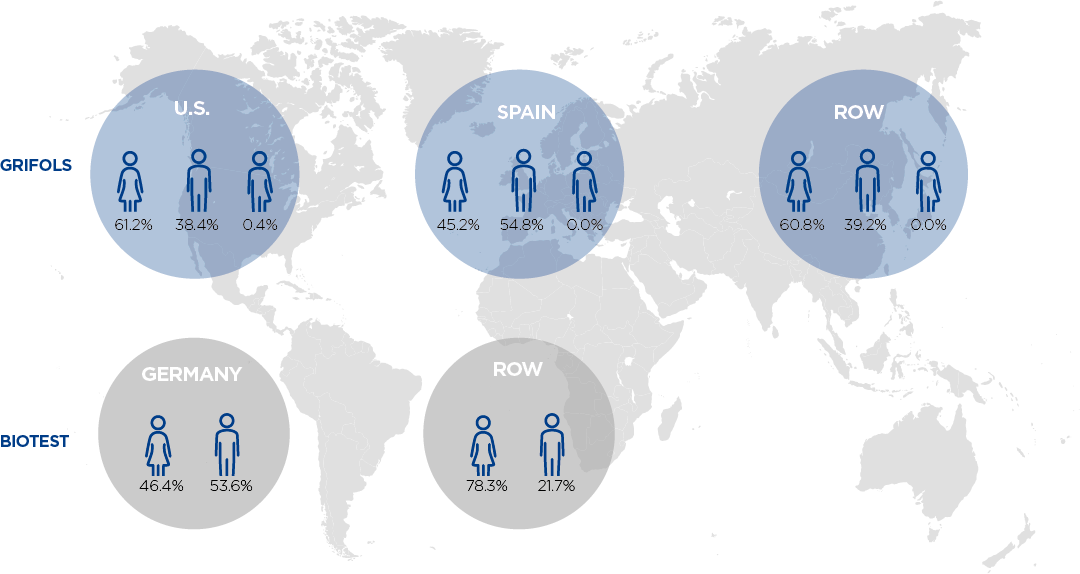
Gender diversity by country
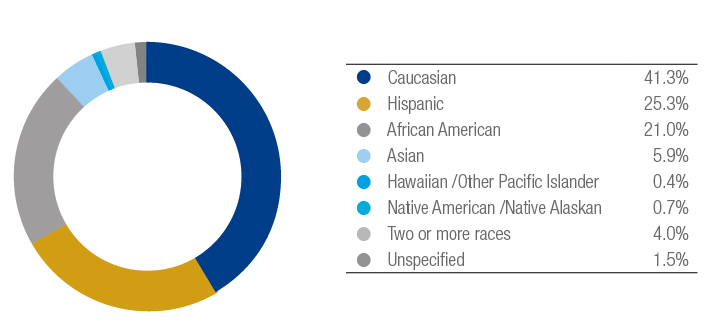
RACIAL DIVERSITY IN THE U.S. - 2023
Anti-discrimination principles and actions
The company has zero tolerance for any type of harassment or discrimination. In 2023, its affirmative action plans translated into 67 measures, compared to 110 in 2022 and 96 in 2021.
Grifols’ development plan features prevention training activities such as courses delivered as part of the Equal Opportunity and Grifols Ethics Line, among others. Both courses are mandatory for Grifols employees.
In 2023, the company received 55 incidents of discrimination reports out of 21,144 employees, compared to 36 incident reports in 2022 out of 23,947 employees, and 52 incidents in 2021 out of 23.234 employees. All complaints were thoroughly investigated and evaluated. In Biotest, there have been 0 reports of discrimination-related incidents in both 2023 and 2022.
While none were deemed discriminatory in legal terms, the company took active measures to cultivate a discrimination-free workplace by imparting training and awareness sessions.
Grifols has a specific procedure to protect employees who report instances of discrimination through the Grifols Ethics Line.
More information Corporate Governance chapter and Grifols Ethics Line
Grifols adheres to:
- International Labour Organization (ILO) principles, created to promote social justice, human rights and the recognition of core labor standards.
- Principles of equal opportunity and non-discrimination in employee recruitment and hiring processes.
- U.S. Department of Labor’s Office of Federal Contract Compliance Programs (OFCCP) regulation, which requires active measures to ensure equal employment opportunity and prevent discrimination based on race, gender, religion, age, sexual identity, disability and other factors.
Zero tolerance for harassment
Harassment is a form of discrimination. Established in 2021, Grifols Harassment Prevention Policy aims to eliminate any offensive verbal, physical or visual behavior and actions directed at employees on the basis of gender, color, race, ethnicity, religion, national origin, age, disability, pregnancy, sexual orientation, gender identity or expression that create an intimidating, offensive or hostile work environment or undermine employees’ professional performance.
Translated into 11 languages and adapted to local regulations, this policy reflects Grifols’ commitment to three fundamental pillars:
- Guarantee of a non-harassment workplace.
- Fair treatment of employees based on mutual respect.
- Cultivation of a workplace culture accepting of individual differences.
The Harassment Prevention Policy outlines specific conducts prohibited by the organization, as well as escalation processes and disciplinary measures in the case of violations.
The aspects contained in the policy are reinforced by employee training. Both factors are essential to prevent, correct and discipline any behavior that violates the policy.
![]()
Training in Grifols Harassment Prevention Policy
+5,100
people
Integrating people with disabilities
Grifols is committed to employing people with disabilities, and only adopts alternative measures when their employment is technically or organizationally infeasible, as defined by the General Disability Law applicable to private- and public-sector Spanish organizations.
n the U.S., Grifols complies with the employment provisions of the Americans with Disabilities Act (ADA), a federal law designed to prevent discrimination and provide equal opportunities for people with disabilities.
Under its Strategic Plan for Diversity, the company formed teams in Ireland, Germany and Spain to attract diverse talent and enhance the employee experience of people with disabilities.
Highlights in 2023 included:
- Heightened Grifols’ presence in specialized forums, university collaborations and partnership to identify and incorporate diverse talent.
- Improved communication and adaptation of the employment platform to ensure accessibility.
- Delivery of employee training sessions and development programs on inclusion of people with disabilities for recruitment managers in the U.S. and Spain.
- Development of a plan for participation in conferences and publication in specialized forums in North America to promote diversity.
- Collaboration with different foundations and organizations to develop specific events co-led by Grifols: TEB Group.
- Creation of steering committee in the U.S. to review and improve the company’s inclusion performance.
We promote universal accessibility
Grifols takes steps to ensure universal accessibility for people with disabilities. When a person with a disability is hired, the company adapts their work station and environment. Grifols complies will all legal regulations in its new buildings and installations and adapts existing structures whenever necessary, applying the principles of accessibility, including the elimination of architectural barriers.
EMPLOYEES WITH DISABILITIES
| 2023 | 2022 | 2021 | |
| Grifols | 785 | 899 | 772 |
| Biotest | 67 | 59 |
![]()
Employees with disabilities in Grifols
785
people
648 in the U.S., 82 in Spain, 54 in Germany and 1 in Ireland
Equal opportunity plans
Grifols’ equal opportunities plan for men and women is extensive to its entire Spanish workforce. Its implementation was negotiated with employee representatives in compliance with Spain’s regulatory framework.
The plan includes 41 gender-equality measures including efforts to guarantee equal pay and opportunities in recruitment processes and internal promotions, and ensure harassment-free workplaces, among others. In force until 2026 and publicly available on REGCON, the plan led to women representing 63% of promotions in 2023.
In its first year, the plan focused on employee communications and a benchmarking of the current situation. In turn, the company created a communication channel and appointed of an equality agent, and led awareness initiatives on the value of equal opportunity between men and women in the workplace.
Among the actions carried out were online and in-person training workshops, imparted to 56% of Grifols’ workforce in Spain as of December 31, 2023.
In 2023, the company negotiated an updated action protocol and measures to address on-the-job harassment, sexual harassment, gender-based harassment, gender, sexual orientation and other instances of workplace aggression. In addition, actions stemming from the employee wellness plan were framed from a gender perspective
For other geographical regions, Grifols applies the principles of equal opportunities defined in the Global Diversity and Inclusion Policy.
A holistic understanding of equality
Grifols works on several fronts to promote gender equality within the organization and beyond. Among its broad-based efforts, the company continuously reviews its promotion processes to detect opportunities for improvement; ensures the use of inclusive language in its internal communications; supports initiatives to boost women’s participation in STEM; and participates in volunteer programs to increase the employability of women at risk of social exclusion.
Internally, the company works to embed equality throughout the organization by implementing and analyzing gender metrics (among other diversities) in its talent development programs and work climate surveys.
Grifols’ affirmative action plan includes an internship program in Spain for women with STEM profiles. In 2023, the program incorporated seven female interns in two departments with a lower presence of women: software and engineering. At the close of this report, one had recently joined as a permanent member of Grifols’ staff.
WOMEN IN GRIFOLS
58%
of Grifols’ workforce are women
40%
of senior management and
directors’ positions are
held by women
63%
of all promotions were
allocated to women
67% of new hires are women
Women in Grifols represent:
39% of directors (172)
41% of senior management (230 / +7.2)
47% of management (595)
48% of senior professionals (954 / +1.9)
52% of professionals (1,424 / +0.6)
63% of administrative and production operators are women (8,856)
One of the world’s top companies for women according to Forbes 2023 ranking
Grifols continues to make progress on its equality and equity roadmap to achieve the goals defined in its 2030 Agenda, including women holding 50% of its senior management positions.
Promoting women in the workplace: Grifols Women in Leadership Awards
In 2023 Grifols launched the Women in Leadership Awards in memory of Dr. Marilyn Rosa Bray, an exceptional Grifols’ leader for 24 years and an outstanding contributor to the plasma industry. The Women in Leadership Awards recognize the work and contributions of women at Grifols, showcasing their achievements as part of its commitment to gender equality.
Talent development
Grifols conducted an Employee Survey in 2020 extensive to the entire workforce, whose findings have served as an entry point to address areas of improvement and initiatives to keep pace with the changing business climate, also in 2023. The next global survey will be carried out in 2024.
In 2023, the company conducted an Engagement Pulse Survey using the Gallup model to capture insights from 4,000 employees across all business areas in Spain, the U.S. and Germany. The survey included 16 questions with a Likert response scale to measure respondents’ level of agreement or disagreement; a Net Promoter Score (NPS) question to assess their degree of employee satisfaction; and an open-ended question.
Based on these results, Grifols will identify employees’ most critical concerns and design country-specific and global action plans to explore potential solutions and employee-engagement strategies. With the 2024 Employee Survey findings, the company expects to discern the effectiveness of actions informed by feedback from the Engagement Pulse Survey. The company will also incorporate and analyze other areas related to the commitment of the employees.
The analysis of results has included a global vision and, additionally, a vision of the results of the main business areas by professional level, country, gender and age that will allow Grifols to adapt the action plans to the different groups identified.
In 2024, Grifols will bolster its talent pipeline through the GROW Program and Talent Program, now in its second edition. Taken together, they will benefit a total of 150 Grifols employees. Merging theory with practice, both programs are designed to inspire new knowledge and impart a unique, high-impact learning experience for all participants. In this regard, program participants acquire a solid theoretical base, combined with practical skills and competencies to enhance their performance in their specific roles. With a focus on talent attraction and development, Grifols’ leadership programs also offer a singular space for reflection, critical to ensuring a deep learning impact.
Our values
- We believe people are the most important asset for a company that aspires to grow
- We advocate recognizing our team members for their contributions to the group
- We seek professionals who support our corporate culture
Our objectives
- Talent recruitment
- Training and development
- Performance management
- Employee commitment and retention
- Internal growth
- Talent and succession
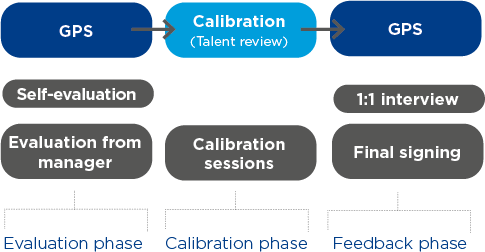
Grifols Performance System
The Grifols Performance System (GPS) is an annual process extensive to the entire organization to ensure managers properly evaluate their team members’ professional performance and provide adequate feedback. Through this process, the company is better equipped to identify high performers and potential areas for improvement.
The GPS’s primary focus is to assess the competencies defined in the Grifols MAP model (competency model based on Grifols values) and each employee’s potential following the Grifols potential model (aspiration + commitment + agility).
Before providing the assessment to the employee, a calibration is made to make sure managers are using the same criteria when measuring their team members’ potential and performance. This calibration is carried out with the collaboration of each business area’s leadership team to guarantee fairness and minimize bias (Talent Review on the Nine Box matrix).
All GPS processes are guided by a common document shared by both the manager and employee, with the following content:
- Current objectives
- Performance appraisal
- Professional development
- Overall performance score
- Overall potential score
- Talent review (performance + potential score)
GPS is a yearly global assessment
It includes three phases, which go from November to November every year.
Linked to other core areas
Enhancements made to the GPS in 2022 and 2023 allow connecting their results to critical human-resource processes:
Direct
- Merit-based compensation: managers are advised not to raise the salaries of poor performers (scores of 1 or 2) beyond labor agreement stipulations.
- Action plan for low-performing employees (scores 1 or 2).
Indirect
- Bonus, a performance metric visible in the GPS.
- Recognition program, connecting it with performance.
For several years running, GPS evaluations have also been used for promotions, internal jobs shifts, the design of individual development plans and determining the participants in Grifols talent programs, among other areas.
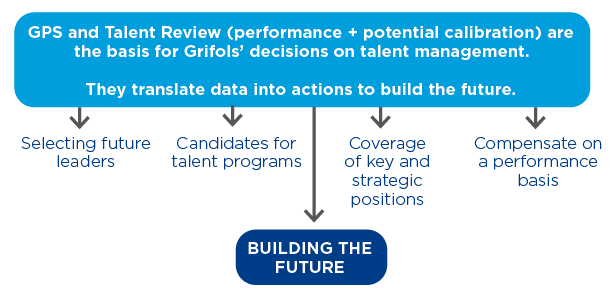
Shaping Grifols’ future-forward strategy
The GPS combined with the Talent Review, conducted midway through the year, have a high impact on future HR decisions. Leveraging these results, the company makes strategic decisions and translates the collected data into actionable insights.
People development programs
 Global Recognition Program
Created to foster a work environment by recognizing and rewarding employees’ contributions, job performance and conduct in alignment with company values. The program focuses on three core dimensions: corporate values, work anniversaries and exceptional performance. Since its July 2022 launch, the company has granted more than 49,000 awards, including 20.400 in 2023.
 Talent Program: Leading the Future
A 12-month leadership program designed to forge and develop Grifols next-generation leaders. Its first edition was held from October 2022-October 2023, welcoming 100 high-potential employees (50% women). The second edition has already commenced this year.
All participants have been identified as “high performing” and “high potential” employees in manager and/or senior manager positions. The program includes in-person group sessions on leadership development competencies; online sessions on new relevant digital trends, personal branding and other issues; self-knowledge and coaching sessions; mentoring sessions with senior company leaders; and work rotations in other departments.
This program supports Grifols’ talent retention by encouraging internal promotions, with 33% of participants from its first edition receiving promotions. In addition, it directly involves Grifols’ top leadership in mentoring and job rotation processes, including the Senior Executive Leadership Team) and senior executives.
The program’s satisfaction scores are 4.7 out of 5, including a 4.9 rating for the in-person meeting to wrap up the first edition.
New leadership programs at Grifols
In 2023, Grifols designed and developed the GROW program, aimed at high-potential, high-performance employees, including senior technicians, specialists and emerging leaders. The first edition is scheduled to commence in 2024 with 50 participants, who will grow professionally through a unique blend of strategic learning and practical insights.
The following programs were also launched:
- The Strategy Program: Designed to enhance the skills, capabilities, and knowledge of 40 executives and senior managers at Grifols.
- The Supervisor Development Programs (SO) in Donation Centers: Aims to provide participants with specific leadership attributes for effectively leading a team. This program will benefit 900 individuals.
- The International Graduate Program: Recruiting 50 young talents for a three-year international program. It is designed to retain the best talents and build a leadership pipeline within Grifols.
Support and employment benefits for Grifols’ employees
- Salary and benefits package
- Teleworking options and policy
- New incentives plan 2023
- Employee wellbeing plans and programs
- Extra contributions to pension plans
- Family support and work-life balance
Attracting new talent
The year 2022 was a turning point for attracting and recruiting the new talent needed to drive plasma recovery in donation centers and the production of plasma-derived medications in the United States. This shift occurred in response to widespread resignations during the pandemic, known as the Great Resignation.
Despite the tight labor market, the company successfully filled more than 6,000 positions, which led to upswings in both its production and economic performance. Talent recruitment has become more agile thanks to greater awareness and recognition of Grifols as an employer.
The Grifols Employer Branding Initiative has played a key role in this regard, reflecting the company’s coordinated efforts to attract, develop and retain talent, improve brand recognition, and enhance employee engagement.
In 2023, the company built on its efforts to reinforce its collaboration network with U.S. academic entities and employment centers, initiated in 2022. It also worked to participate in more large-scale job fairs in high schools and community colleges, and spearhead new internal and external communication and awareness campaigns.
Student internships
Grifols collaborates with several educational institutions, primarily universities, to offer corporate internships for their students. Through these experiences, interns gain hands-on training and new competencies to complement their classroom learning and prepare for their future careers.
Created in 2017, Grifols’ internship policy assigns a company tutor or representative to each participant to support them throughout their learning journey. Corporate internships are six to 18 months in duration.
![]()
948
interns since 2017
162
joined Grifols’ workforce
249
people interned at Grifols in 2023
Driving continuous development
Employee training is a cornerstone of Grifols’ professional and talent development. The company works to assure all employees have access to continuous training and learning opportunities, as defined in its global training and development strategy.
This strategy reflects the organization’s corporate values and offers a framework to address the needs detected in individual, team, business and organizational areas.
Grifols’ professional development opportunities foster a learning culture of personal accountability, and are continuously adapted to reflect evolving business priorities, economic shifts and future trends.
Training activities are evaluated based on learners’ degree of satisfaction and their applicability to their specific roles. In the case of Grifols on-demand learning, employees are able to choose from a portfolio of learning resources based on their individual needs.
OUR CULTURE OF LEARNING IN 2023
Online training
93%
of training activities in
2023
Commitment to online development
Multicultural sensitivity
- Centered on multicultural differences and business protocols
- Continuation of "Doing Business in China" in 2023
- Expansion of Percipio portfolio offerings in 2024
On-demand learning
21,000+
Grifols employees
have acccess to on-demand
training
Delivery on an online learning platform
Global Percipio (Skillsoft) platform is globally available
Employee development innovations
Grifols opened its manufacturing training center in Parets del Vallès (Barcelona, Spain) in 2022. This center employs process and procedural simulations outside manufacturing areas, allowing to team members to acquire new skills in a risk-free environment.
The company consolidated the use of virtual reality learning for onboarding processes in 2023, with plans to extend its implementation in Grifols Professional Development Academy, which delivers a more immersive and interactive learning experience. In 2022, Grifols’ Barcelona and Dublin training centers were the first to incorporate VR technology.
Grifols was recognized with the Gartner Eye on Innovation Awards in the life science category for its success in leveraging virtual and augmented reality solutions to drive cultural change within the organization.
Especially noteworthy in 2023 was the global launch of the Skillsoft Percipio platform, accessible to all Grifols employees. Using this platform, learners can enhance their skillsets and enjoy an immersive learning experience from any device. With 8,400 courses on offer, it stands out for its global accessibility, choice of 18 languages and distribution in 700 channels. Its content covers an array of topics, including digital transformation, leadership, diversity, equality and inclusion, collaboration, personal wellbeing and productivity and process improvements.
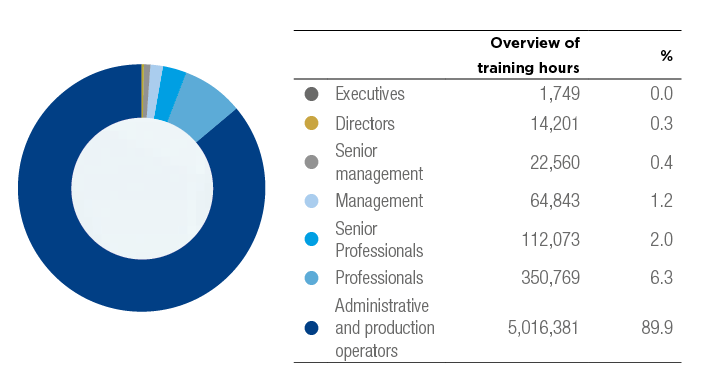
OVERVIEW OF GRIFOLS EMPLOYEE DEVELOPMENT
5,582,576
training hours
69% training hours delivered to women
31% training hours delivered to men
Training hours by region
4,962,428
United States
94% of the workforce received training
303,290
Spain
96% of the workforce received training
316,857
rest of the world
91% of the workforce received training
Training in health, safety and environment
96,759
training hours
Represents 2% of the company’s total training hours
5,758
training hours at Biotestt
Represents 10% of total training hours at Biotest
Training in Biotest t
58,835
training hours
46% delivered to women
54% delivered to men
More details on training hours at Grifols is available at the end of this chapter.
Training programs
Executive development
These programs focus on the continuous reinforcement of leadership and coaching skills. In 2023, the company reinforced its emphasis on change management and communication skills, with special attention paid to self-leadership (leading oneself) and team leadership (leading others).
Core programs:
- Grifols Leadership Exchange Program: ongoing development program targeting managers and high potentials in the industrial sector.
- Week of Learning: Encourages Los Angeles-based technicians and supervisors to prioritize learning development. Throughout the week, employees gained new insights into an array of leadership and technical development topics.
- Evolving Leadership: 6-month program to bolster the leadership skills of 20 mid-level managers in Ireland to reinforce the subsidiary’s leadership pipeline and advance its strategic priorities.
- "Leading the Future" Talent Program: 12-month global program to prepare Grifols’ future leadership team.
- International short ad-hoc programs: "Leadership by Objectives in Flexible Environments", "The Development and Performance Interview", "Digital Leaders".
New programs:
- Leading in Times of Change: 160 leaders from Grifols’ U.S. and Spanish operations participated in development initiatives to strengthen their resilience and communication competencies in times of flux.
- Leading People and Teams: redesign of a core Grifols leadership program, now delivered in a 4-month format with personalized support. The company has successfully imparted several editions in Spain.
- Finance for Non-Financial Professionals: More than 40 leaders have taken part in this program to expand their knowledge of key financial principles. Grifols will expand its delivery to a wider audience in 2024 following the successful launch of its first edition in Spain.
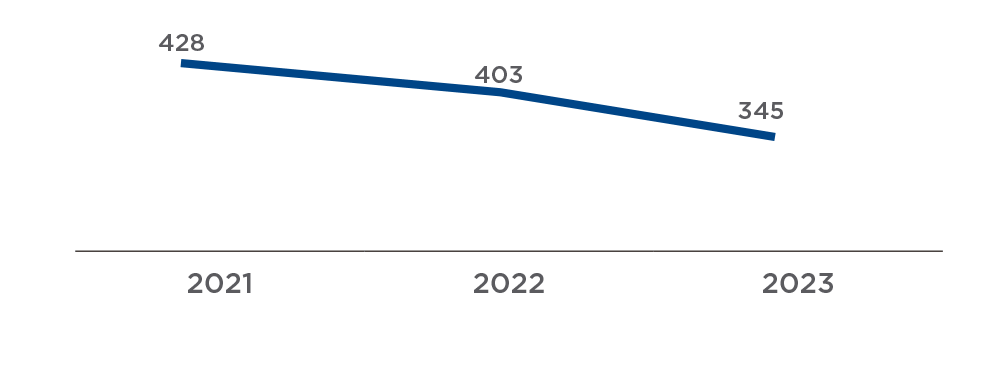
NUMBER OF TRAINED DIRECTORS

Educational Expenses Reimbursement Program
Grifols also gives employees the chance to take part in professional development opportunities outside the organization, contributing to its culture of ongoing learning and improvement. This program offers employees the necessary flexibility and financial support to earn official higher education degrees and professional certifications.
EDUCATIONAL GRANTS (NO. OF BENEFICIARIES)
![]()
~3,000
executives
took part in Grifols
development programs
over the last 4 years
+860,000€
allocated to programs
Grifols Academy: differential learning opportunities
Created in 2009, Grifols Academy reflects the company’s staunch commitment to its employees, continuous development and diverse social agents. The Academy comprises three distinct entities–Academy of Professional Development, Academy of Plasmapheresis and Academy of Transfusion Medicine–each with its distinct educational focus.
Under its umbrella, Grifols promotes employees’ educational and professional development, inculcates corporate values, and provides resources and services to medical professionals worldwide to help them offer better patient care.
In addition to educating employees, Grifols Academy development programs and training activities inspire the exchange of plasma-sector knowledge and experiences, making them a differential offering.

The Professional Development arm offers training and professional development programs to reinforce employees’ corporate competencies and values. Its three core training areas include corporate competency development, leadership development and onboarding actions.
In 2023, the company revised its value proposition to adapt it to its new strategic needs in a globalized environment in continuous flux. Another key focus was its international expansion in Central Europe, Egypt, China and Canada.
| THE GRIFOLS ACADEMY - PROFESSIONAL DEVELOPMENT | |||
| 2023 | 2022 | 2021 | |
| No. of participants | 2,399 | 2,001 | 2,068 |
| No. of training sessions | 108 | 135 | 163 |
| Online training hours | 12,504 | 4,468 | 5,630 |
The Grifols Academy-Plasmapheresis delivers general and specialized plasma-specific training on leadership, quality, operations and medicine to accelerate the professional development of U.S.-based employees.
In 2015, it received a five-year approval from the Accrediting Commission of the Accrediting Council for Continued Education and Training (ACCET), which is valid until December 2024.
The Grifols Academy continued to enrich its learning portfolio in 2023.
| THE GRIFOLS ACADEMY - PLASMAPHERESIS | |||
| 2023 | 2022 | 2021 | |
| No. of participants | 6,573 | 13,736 | 9,731 |
| On-campus participants | 491 | 893 | 495 |
| Remote participants | 0 | 110 | 85 |
| No. of online training hours | 9,790 | 39,099 | 42,492 |
| No. of hours of distance learning | 0 | 2,468 | 1,631 |
More information: The Grifols Academy.
The Grifols Academy, an inspiration for other organizations
In 2023, Grifols renewed its 10-year contract with Licon, a Mexican company specializing in clinical diagnostics and transfusion medicine, which has been distributing Grifols’ diagnostic solutions in this market for more than 23 years. Inspired by The Grifols Academy learning methodology, it founded The Licon Institute in 2004 to offer development opportunities for diagnostics professionals in the region. Since its creation, the Licon Institute has trained more than 21,000 professionals in Mexico and Latin America.
Fair compensation practices
Remuneration system
Grifols’ remuneration philosophy is grounded on meritocracy and equal opportunities, with an emphasis on employees’ professional performance and contributions toward the company’s strategic objectives and long-term sustainability.
The company guarantees non-discrimination on the basis of gender, age, race, religion, sexual orientation or other personal factors.
Grifols’ remuneration policy aspires to compensate employees objectively and coherently according to their level of responsibility and performance.
Each country offers fair and competitive compensation packages adapted to the local market and guided by the following core principles:
- Fixed salary based on the level of responsibility of the position, the employee’s career path and labor market practices in alignment with country-specific regulations. Positions have defined salary ranges, which are reviewed every year.
- Variable retribution such as bonds or monetary incentives linked to the achievement of concrete and measurable objectives previously defined and communicated.
- Compensation packages reflective of market trends and employee needs. Grifols offers numerous social benefits and programs in its countries of operation adapted to the local context. These include medical insurance policies, pension plans, life and/ or accident insurance, travel insurance, tuition grants, well-being plans and discounts on products or services.
Every year, an external competitiveness remuneration analysis is conducted to assess Grifols’ compensation practices and ensure they reflect industry best practices, as outlined in the company’s remuneration policy.
Grifols makes every effort to ensure its employees enjoy a decent living wage in line with their country’s economic context. To this end, it performs an annual review to assess country-specific costs of living and market wages, periodically updating compensation levels as needed.
New incentive plans
Grifols announced two new incentive plans in the first half of 2023: a short-term incentive plan (STIP) extensive to the entire workforce, and a long-term incentive plan (LTIP) that grants stock options for roughly 220 Grifols employees, including certain executive directors and senior-level leaders.
In general, these incentive plans are based on the attainment of predetermined and quantifiable financial and non-financial (ESG) objectives, with vesting contingent on positive individual performance evaluations. Both incentive plans were ratified at the Annual General Shareholders’ Meeting in May.
Moving towards pay equity
Grifols does its utmost to ensure equal opportunities and remuneration, regardless of gender in reflection of its staunch commitment to pay equality. The company analyzes its adjusted and unadjusted gender pay gap every year as part of these efforts. In 2023, Grifols received external support from the global consulting firm EY to ensure the maximum rigor and transparency in its analysis.
The unadjusted wage gap is calculated as the difference between the average wage of men and the average wage of women, calculated with respect to the average wage of men. For the purposes of this report, the average wage is taken to be the mean annual gross fixed wage at 100% employment.
On the other hand, the adjusted wage gap is considered more accurate, since it is calculated by applying econometric models that allow us to compare the wages at 100% employment for men and women, isolating the effects generated by differences in socioeconomic characteristics (such as age, seniority, geographic area or educational level) or job characteristics (such as type of working day, type of activity or professional category).
This report contains an analysis of the pay gap in Spain, the U.S., Germany and Ireland, which together account for more than 90% of the group’s workforce.
In Spain, Ireland and Germany, the unadjusted pay gap is below the national average pay gap according to the World Economic Forum’s Global Gender Gap Report 2023. In the case of the United States, it is within the same range.
The company’s results by professional category highlight its progress in augmenting women’s presence in leadership roles and pay equality, with concrete metrics outlined in the 2022-2024 Global Diversity Plan.
These measures have led to an increase in the percentage of women in senior positions in recent years. In 2023, the percentage of women in the Executives category rose to 23.81%. In the Directors category, female representation was 38.8% in 2023.
In parallel, the Grifols 2030 Agenda includes a target of 50% women in Senior Management positions. This figure stood at 41.6% at year-end 2023.
The company believes that the increased presence of women in these professional categories will have a positive impact on pay gap calculations.
Grifols also addresses the promotion of women in STEM (Science, Technology, Engineering and Mathematics) positions as another priority factor to continue promoting wage parity, whose cultural component must be balanced. In this regard, the company spearheads several initiatives and measures to identify STEM roles and foster greater access for women.
In addition to the aforementioned action plans– important for their direct relationship with reducing the gender wage gap–the company is also improving its selection, salary review and promotion processes to ensure they are integrated into indidividual performance evaluations and reflect common, transparent and gender-neutral criteria. At the same time, it is promoting flexible work schedules extensive to all employees, and training and professional development initiatives to bolster the pipeline of female talent and incorporate more women in leadership roles.
As outlined in Grifols 2030 Agenda, the company works to ensure that women make up 50% of candidate interviews for managerial roles and higher.
| EQUAL PAY FOR SIMILAR JOBS 2023 | ||||
| Spain | U.S. | Ireland | Germany | |
| Salary gap by country* | 35% | 23% | 31% | 39% |
| Grifols | ||||
| Adjusted pay gap** | 3.19% | 1.2% | 1.76% | 2.32% |
| Unadjusted pay gap*** | 12.50% | 24.4% | 7.9% | 16.71% |
*Source: Global Gender Gap Report 2022
** Details and comments on the methodology and its calculation are available in Chapter 9 "About this Report."
*** Difference between the average wage of men and the average wage of women, calculated with respect to the average wage of men. In this
regard, average salary is understood as the average annual gross fixed salary at 100% of occupation (SFB100%) (Wage gap = [SFB100% average
male - SFB100% average female] / SFB100% average male).
An overview of remuneration tables is available at the end of this chapter
Grifols continues to advance pay parity
Equality and wage gap: Grifols in Spain
The adjusted pay gap stands at 3.2% in 2023, reflecting the company’s commitment to pay parity. Worth highlighting is the reduction in the Director category (-1.4%) as a result of a 16% uptick in female participation in this grouping, stemming mainly from promotions of women to Senior Management positions.
At country level, the unadjusted salary gap was 35%. In Grifols, this gap stands at 12.5%, well below the national result.
| 2023 | 2022 | 2021 | |
| Spain unadjusted | 35% | 38.4% | 40.2% |
| Grifols adjusted | 3.2% | 3.0% | 3.2% |
| Grifols unadjusted | 12.5% | 12.1% | 12.4% |
![]()
19.8%
employees
in Spain over total
workforce
45.2%
are women
Equality and wage gap: Grifols in U.S.
In 2023, Grifols continued its efforts to advance pay parity and promote women’s access to leadership roles.
The company’s adjusted gender wage gap in the U.S. was 1.2%, while its gross pay gap stood at 24.4%, compared to 24.6% in 2022. Grifols recorded narrower gross pay gaps in both the Directors (-1.7%) and Management (-2%) categories.
The unadjusted wage gap in the U.S. stood at 23%, compared to 22.8% in 2022.
Grifols’ U.S. workforce decreased by roughly 16% in 2023 from the previous year, with no impacts on its gender composition.
| 2023 | 2022 | 2021 | |
| EE.UU. unadjusted | 23% | 22.8% | 33.2% |
| Grifols adjusted | 1.2% | 0.9% | 2.1% |
| Grifols unadjusted | 24.4% | 24.6% | 28.1% |
![]()
65.8%
employees
in the U.S. over total
workforce
61.2%
are women
Equality and wage gap: Grifols in Ireland
In 2023, Grifols’ adjusted gender wage gap in Ireland fell by a percentage point to 1.8% (2.8% in 2022). Its unadjusted wage gap stood at 7.9%, decreasing notably from the 15.8% reported in 2022. In terms of professional categories, the wage gap declined in both Senior Management (-13.7%) and Management (-6.5%) groupings.
The 7.9% decrease in the pay gap is evidence of the company’s concerted efforts to ensure men and women enjoy the same salary conditions when performing the same role.
Ireland’s unadjusted gender wage gap stodd at 31% in 2023, far above the 7.9% gap at Grifols.
Grifols’ employee base in Ireland expanded by more than 10% last year, with no changes to the proportion of men and women in its workforce compared to 2022.
| 2023 | 2022 | 2021 | |
| Irlanda unadjusted | 31% | 29.7% | 31.0% |
| Grifols adjusted | 1.8% | 2.8% | 0.1% |
| Grifols unadjusted | 7.9% | 15.8% | 17.4% |
![]()
1.8%
people in Ireland
over total workforce
44.7%
are women
Equality and wage gap: Grifols in Germany
Grifols’ adjusted gender wage gap in Germany was 2.3% in 2023. Worth noting were narrower pay gaps in the Director (-2.6%) and Senior Management (-14.3%) categories.
The unadjusted gender wage gap is 16.7%, well below the national average of 39%.
| 2023 | 2022 | 2021 | |
| Germany unadjusted | 39% | 41.4% | 38.6% |
| Grifols adjusted | 2.3% | 1.4% | 0.5% |
| Grifols unadjusted | 16.7% | 14.5% | 18.3% |
![]()
6.3%
people in
Germany over total
workforce
71.1%
are women
Details on the gender pay gap are available in the tables at the end of this chapter.
Relationships built on trust
Social dialogue
For Grifols, engaging in social dialogue with worker representatives is critical to collaboratively address the transversal issues that require collective bargaining in its various workplaces. The Spanish labor-relations system defines two types of company representation: trade union representation and unitary or elective representation. These people include members of trade unions, company committees and personnel delegates, with whom Grifols holds regular meetings to address issues affecting the workforce. In other countries such as France and Germany, Grifols routinely meets with workers’ legal representation. In Italy, company decisions that could impact collective working conditions are discussed with trade union organizations
Collective labor agreements
Grifols’ employees in Spain, Germany, Italy, France, Argentina and Brazil work under collective agreements.
In 2023, 4,444 employees were covered by these agreements, representing 21.0% of Grifols’ workforce.
n 2023, 4,444 employees were covered by these agreements, representing 21.0% of Grifols’ workforce. In the United States, industry-level collective bargaining does not exist, so negotiations are carried out at the company level. The Taft-Hartley Act regulates industry-specific benefit plans and states that federal courts have jurisdiction to enforce collective bargaining agreements.
In Biotest, 62% of the workforce is covered by collective agreements.
Worker representation committees
In Spain, Chile and Germany, where labor committees are established by law, Grifols assigns managers to oversee the prevention of occupational health and safety risks.
In 2023, most of Grifols employees in Spain were represented by a joint committee comprised by employees and occupational health and safety managers. In Chile and Germany, 100% of employees were represented by these committees. There is no formal representation in the remaining Grifols subsidiaries. In these markets, the company regularly communicates and consults with its specific workforces, which establish committees that welcome employees’ participation and proposals. Each subsidiary defines the frequency of these meetings and subsequent follow-up of the committee’s specific plans, actions and measures.
Savings forecasting system
Grifols’ employee remuneration packages include a range of social benefits. In most countries, benefits include retirement savings instruments, and death and disability coverage.
These long-term savings systems are designed according to the specific practices, particularities and social welfare needs of each country.
In Spain, retirement savings are mainly framed within a public protection system. Notwithstanding, Grifols promotes contributions to employee pension plan offered to team members in certain categories, doubling their contributions.
In addition, in December 2019, the Partial Retirement Agreement signed with labor unions came into force in Spain. This accord regulates access to partial retirement at Grifols until December 2025.
The U.S. model transfers the coverage of pension services to the private sector and personal initiative, as established by Employee Retirement Income Security Act (ERISA) standards.
Grifols offers its U.S. employees the option of contributing to a 401(k) Retirement Plan, allocating a maximum 5% of their annual salary depending on their individual contributions.
Ireland also has a public retirement benefit system. Grifols employees in this country have the option of leveraging a corporate pension plan based on a defined contribution scheme. In this way, employees can grow their retirements savings by making contributions of 5% of their salary, which the company supplements with an additional 5%.
Based on the characteristics of each model and current country-specific legal regulations, Grifols made the following contributions to pension plans:
| CONTRIBUTION TO LONG-TERM SAVING SYSTEMS | |||||||||
| Miles de euros | 2023 | 2022 | 2021 | ||||||
| Women | Men | Total | Women | Men | Total | Women | Men | Total | |
| Spain | 472.9 | 606.0 | 1,079,0 | 448.7 | 584.1 | 1,032,8 | 419.3 | 528.5 | 947.8 |
| U.S. | 14,502.9 | 15,627.6 | 30,130.5 | 15,406.4 | 15,652.4 | 31,058.8 | 12,426.1 | 13,539.4 | 25,965.5 |
| ROW | 516.5 | 436.8 | 953.2 | 384.4 | 412.2 | 796.6 | 435.0 | 403.6 | 838.6 |
| Total | 15,492.3 | 16,670.3 | 32,162.7 | 16,239.5 | 16,648.7 | 32,888.2 | 13,280.4 | 14,471.5 | 27,751.9 |
| % | 48.2% | 51.8% | 100.0% | 49.4% | 50.6% | 100.0% | 47.9% | 52.1% | 100.0% |
| CONTRIBUTION TO LONG-TERM SAVING SYSTEMS - BIOTEST | |||
| Euros | 2023 | ||
| Women | Men | Total | |
| Germany | n/a | n/a | 4,920,204.00 |
| Spain | 0.00 | 0.00 | 0.00 |
| U.S. | 0.00 | 0.00 | 0.00 |
| ROW | 46,760.47 | 86,770.83 | 133,531.30 |
Data not disclosed for Germany due to confidentiality and personal data protection reasons.
Occupational health and well-being
Grifols’ Occupational Health and Safety area establishes annual objectives, as well as oversees an audit program to supervise the health-related management systems of its subsidiaries. In addition to its planned objectives, Grifols approved a new Mental Health Policy and the continuity of the Wellbeing Program in 2023.
Grifols has an occupational health and safety structure in all of its countries of operation, in addition to a corporate Occupational Health and Safety Department that serves the entire group.
Mental Health Policy, leading by example
Enhancing people’s health and well-being is Grifols’ raison d’être.
The company supports the European Union’s calls to promote mental health care and eliminate the stigma surrounding it. To this end, in 2023 Grifols implemented a new corporate mental health policy to support and safeguard the mental health policy of its employees. In addition, the company also rolled out an action plan with three main objectives: to monitor overall mental health and well-being indicators; provide resources to prevent and manage anxiety and stress; and foster a culture that prevents health-related discrimination. Grifols’ mental health policy and initiatives became effective in 2022, positioning the company at the forefront of this critical domain.
Mental Health Plan: 3 core pillars
Prevention
- Awareness campaigns
- Specific training on the Mental Health Policy
- Training on mental health resources
- Embellishment of spaces to create healthy work environments
- Suicide and bullying protocols
- Efforts to cultivate a positive work environment
Detection
- Mental health questionnaires
- Risk evaluations
- Procedures for detected cases
- Communication channels
Performance
- Monitorization of indicators
- Psychological consultations
- Action plans deriving from detection resources
Comprehensive management of occupational health and well-being
 |
Management system |
Grifols workplaces in Spain are all ISO 45001-certified. A three-year plan is under way to earn ISO 45001 certification for all U.S. manufacturing plants by 2030. Grifols international subsidiaries have country-specific systems in accordance with corporate policy and standards. In 2023, Grifols implemented five new occupational health and safety standards, which are extensive to the entire group. |
 |
Hazard identification and risk minimization |
Integrated into the design phase of manufacturing plants, process changes and the acquisition of new equipment. |
 |
Occupational health and safety training and awareness programs |
All Grifols employees receive training and information on occupational health and safety issues, starting in the onboarding phase and throughout their tenure at the company. In 2023, Grifols rolled out a new behavior-based safety (BBS) program in Spain, following its effective implementation in the U.S. There are plans to extend the BBS program to Ireland and Germany (Haema) in 2024. |
 |
Promoting employee health and well-being |
Grifols heads several programs in its core countries of operation. In 2022, the company launched the “Take Care of Your Heart” program, a three-year wellness plan extensive to all subsidiaries focused on preventing cardiovascular diseases. Globally, it led actions related to alcohol consumption, nutrition, mental health and physical exercise. |
 |
Management in contractor operations |
Grifols’ production centers have management procedures regarding contractor management. In Spain, contractors are required to outline their occupational-risk prevention measures on an IT platform in order to access Grifols installations. The procedures for each company are subject to health and safety corporate audits. |
Promoting our employees’ health and well-being
Strategic Wellness Plan: Take care of your heart
This three-year plan addresses two specific cardiovascular risk factors every year. Areas of emphasis were mental health and exercise in 2022, and alcohol abuse and nutrition in 2023. Restorative sleep and tobacco use will be the areas of focus in 2024.
Activity overview
| 2022 Physical exercise and mental health |
2023 Physical exercise, mental health, alcohol abuse and nutrition |
| Physical exercise Initiatives and results: campaign organized by teams. The Grifols Worldwide Challenge included: 1,106 participants 97 teams 35+ million steps |
Physical exercise Initiatives and results: Sports day, online yoga courses and city bicycle routes, among others. 933 participants |
| Mental health Initiatives and results: Global monthly mental health tips and mindfulness masterclasses. Also included were counselling and emotional support sessions in Spain and Ireland. In Spain, new tools were integrated in the health surveillance examinations (PHQ-4 questionnaire and Goldberg test) to continuously take the pulse of the organization’s psycho-emotional state and help detect situations that might induce anxiety or depression. 186 participants stress management 9 mindfulness 66 emotional intelligence |
Mental health Initiatives: Approved in 2023, Grifols’ new Mental Health Policy is supported by a broad action plan to monitor mental health and well-being indicators in our workforce. |
| Nutrition Initiatives and results: "Take Care of Your Heart" program, with knowledge pills on the benefits of healthy eating habits and daily exercise, and the option of taking part in 30-day wellness journeys 2,659 participants |
|
| Alcohol abuse Initiatives and results: Tips and advice for employees on alcohol consumption, as well as a masterclass in English and Spanish, with a total of 300 people in attendance. 300 participants |
First edition of EnjoIGrifols
EnjoIGrifols is led by Instituto Grifols (IG) staff in Spain with the support of HR management to promote a positive working environment and reinforce ties among IG teams. The first edition welcomed over 350 employees, who participated in sports initiatives (basketball, paddle tennis, cross fit, hatha and viniyoga) and recreational activities (theater and art workshops).
Performance in occupational health and safety
The employees from the United States, Spain, Ireland, and Germany accounts for approximately 95% of Grifols’ total workforce. Grifols’ subsidiaries each monitor country-specific indicators, including accident rates and other health metrics.
The company investigates all workplace accidents with and without leaves, minor incidents, and commuting accidents in countries where these are regulated. At the same time, it works continuously to improve its occupational health and safety systems.
There have been no cases reported of work-related illnesses in Grifols production facilities. All work processes, including the collection and handling of plasma donations, follow rigorous protocols with technical, organizational and personal measures. Grifols has a program to control the exposure to identified risk factors to prevent workplace accidents and take actions whenever necessary. Risk characterization depends on the activity performed and differs significantly between production centers and plasma donation centers. The company has had no fatal accidents in the last 5 years.
Absenteeism
The health, safety and well-being of Grifols’ employees directly impact its incidence of absenteeism. The company has a management model with specific benchmarks to quantify the cost impact of absenteeism, as well as measures to promote overall employee health and well-being to adress its most common causes.
In Spain, these include a physical therapy service prevent musculoskeletal injuries, a 24-hour medical service, psychosocial risk assessments and wellness plans. The company also carries out awareness sessions, return-to-work interviews after extended leaves, and communication protocols for employee absences.
Details on the absenteeism are available in the tables at the end of this chapter.
Work-life balance
In today’s global environment, Grifols recognizes employees’ need for trust-based relationships and flexibility to better manage their work time while strike a positive work-life balance.
To this end, Grifols implemented the “Flexibility for U” initiative, with the aim of fostering mutual trust and responsibility between the company and its global talent pool.
The program includes a range of actions to reflect the diverse profiles within the Grifols workforce.
In 2023, 65% of eligible employees had taken part in this initiative, which includes:
- Option of teleworking 40-80% of weekly work schedule, depending on the job function.
- Flexible 3-hour window on either side of the employee’s core hours.
- Possibility of more remote work positions.
- Implementation of intensive work schedule on Fridays in labor markets where this is a common practice.
- These measures complement the existing ones, such as those related to digital disconnection.
In its U.S. installations, Grifols offers paid 4-week parental leave for full-time employees to care for their newborn children or newly adopted children under the age of 18.
Employee key performance indicators
Average workforce distribution*
| AVERAGE WORKFORCE BY COUNTRY | ||
| 2023 | 2022 | |
| U.S. | 13,143 | 15,669 |
| Spain | 4,095 | 4,082 |
| Rest of the world | 2,781 | 2,699 |
| Total | 20,019 | 22,450 |
| AVERAGE WORKFORCE BY COUNTRY - biotest | |
| 2023 | |
| Germany | 1,950 |
| Spain | 0 |
| U.S. | 0 |
| Rest of the world | 537 |
| Total | 2,487 |
| AVERAGE WORKFORCE BY REGION AND TYPE OF CONTRACT | ||||||
| 2023 | 2022 | |||||
| Permanent | Temporary | Total | Permanent | Temporary | Total | |
| U.S. | 13,139 | 4 | 13,143 | 15,665 | 4 | 15,669 |
| Europe | 6,091 | 238 | 6,330 | 5,982 | 254 | 6,236 |
| Rest of the world | 538 | 8 | 546 | 535 | 10 | 545 |
| Total | 19,768 | 250 | 20,019 | 22,181 | 268 | 22,450 |
| AVERAGE WORKFORCE BY REGION AND TYPE OF CONTRACT - biotest | |||
| 2023 | |||
| Permanent | Temporary | Total | |
| U.S. | 0 | 0 | 0 |
| Europe | 2,335 | 153 | 2,487 |
| Rest of the world | 0 | 0 | 0 |
| Total | 2,335 | 153 | 2,487 |
| AVERAGE WORKFORCE BY AGE | ||
| 2023 | 2022 | |
| <30 | 5,154 | 6,216 |
| 30-50 | 10,537 | 11,706 |
| >50 | 4,327 | 4,528 |
| Total | 20,019 | 22,450 |
| AVERAGE WORKFORCE BY AGE - biotest | |
| 2023 | |
| <30 | 476 |
| 30-50 | 1,333 |
| >50 | 679 |
| Total | 2,487 |
| AVERAGE WORKFORCE BY GENDER AND TYPE OF CONTRACT | ||||||
| 2023 | 2022 | |||||
| Permanent | Temporary | Total | Permanent | Temporary | Total | |
| Women | 11,318 | 140 | 11,459 | 13,217 | 145 | 13,362 |
| Men | 8,403 | 110 | 8,513 | 8,938 | 124 | 9,062 |
| Non-binary and undeclared | 47 | 0 | 47 | 26 | 0 | 26 |
| Total | 19,768 | 250 | 20,019 | 22,181 | 268 | 22,450 |
| AVERAGE WORKFORCE BY GENDER AND TYPE OF CONTRACT - biotest | |||
| 2023 | |||
| Permanent | Temporary | Total | |
| Women | 1,202 | 120 | 1,322 |
| Men | 1,133 | 33 | 1,166 |
| Total | 2,335 | 153 | 2,487 |
The average workforce of Grifols has been calculated for this report as the average of full-time equivalents (FTEs) over the 12 months of the year. The average workforce of Biotest has been calculated as the average headcount over the 12 months of the year.
| AVERAGE WORKFORCE BY PROFESSIONAL GENDER AND WORKING HOURS | ||||||
| 2023 | 2022 | |||||
| Full time | Part time | Total | Full time | Part time | Total | |
| Women | 10,793 | 665 | 11,459 | 12,613 | 749 | 13,362 |
| Men | 8,248 | 265 | 8,513 | 8,778 | 283 | 9,062 |
| Non-binary and undeclared | 46 | 1 | 47 | 25 | 1 | 26 |
| Total | 19,087 | 931 | 20,019 | 22,181 | 268 | 22,450 |
| AVERAGE WORKFORCE BY PROFESSIONAL GENDER AND WORKING HOURS - biotest | |||
| 2023 | |||
| Full time | Part time | Total | |
| Women | 935 | 387 | 1,322 |
| Men | 1,084 | 82 | 1,166 |
| Total | 2,018 | 469 | 2,487 |
| AVERAGE WORKFORCE BY WORKING HOURS AND AGE | ||||||||
| 2023 | 2022 | |||||||
| <30 | 30-50 | >50 | Total | <30 | 30-50 | >50 | Total | |
| Full time | 4,871 | 10,071 | 4,145 | 19,087 | 5,818 | 11,244 | 4,355 | 21,417 |
| Part time | 283 | 466 | 182 | 931 | 398 | 462 | 173 | 1,033 |
| Total | 5,154 | 10,537 | 4,327 | 20,019 | 6,216 | 11,706 | 4,528 | 22,450 |
| AVERAGE WORKFORCE BY WORKING HOURS AND AGE - biotest | ||||
| 2023 | ||||
| <30 | 30-50 | >50 | Total | |
| Full time | 402 | 1,088 | 529 | 2,018 |
| Part time | 74 | 246 | 150 | 469 |
| Total | 476 | 1,333 | 679 | 2,487 |
| AVERAGE WORKFORCE BY TYPE OF CONTRACT AND AGE | |||||||||
| 2023 | 2022 | ||||||||
| <30 | 30-50 | >50 | Total | <30 | 30-50 | >50 | Total | ||
| Permanent | 5,072 | 10,422 | 4,274 | 19,768 | 6,125 | 11,577 | 4,478 | 22,181 | |
| Temporary | 82 | 115 | 53 | 250 | 91 | 128 | 49 | 268 | |
| Total | 5,154 | 10,537 | 4,327 | 20,019 | 6,216 | 11,705 | 4,528 | 22,450 | |
| AVERAGE WORKFORCE BY TYPE OF CONTRACT AND AGE - biotest | ||||
| 2023 | ||||
| <30 | 30-50 | >50 | Total | |
| Permanent | 412 | 1,259 | 664 | 2,335 |
| Temporary | 64 | 74 | 15 | 153 |
| Total | 476 | 1,333 | 679 | 2,487 |
| AVERAGE WORKFORCE BY PROFESSIONAL CATEGORY AND GENDER | |||||||||
| 2023 | 2022 | ||||||||
| Women | Men | Non-binary and undeclared | Total | Women | Men | Non-binary and undeclared | Total | ||
| Executives | 24.9% | 75.1% | 0.0% | 122 | 22.4% | 77.6% | 0.0% | 100.0% | |
| Directors | 40.2% | 59.7% | 0.1% | 449 | 41.2% | 58.3% | 0.5% | 100.0% | |
| Senior management | 41.5% | 58.5% | 0.0% | 556 | 39.2% | 60.8% | 0.0% | 100.0% | |
| Management | 46.6% | 53.4% | 0.0% | 1,270 | 47.4% | 52.5% | 0.0% | 100.0% | |
| Senior Professionals | 48.1% | 51.8% | 0.1% | 1,986 | 46.6% | 53.3% | 0.0% | 100.0% | |
| Professionals | 52.7% | 47.2% | 0.1% | 2,700 | 52.3% | 47.6% | 0.1% | 100.0% | |
| Administrative staff / Manufacturing operators | 62.2% | 37.5% | 0.3% | 12,936 | 65.3% | 34.6% | 0.1% | 100.0% | |
| Total | 57.2% | 42.5% | 0.2% | 20,019 | 60.0% | 40.0% | 0.0% | 100.0% | |
| AVERAGE WORKFORCE BY PROFESSIONAL CATEGORY AND GENDER - biotest | |||
| 2023 | |||
| Women | Men | Total | |
| Executives | 32.4% | 67.6% | 6 |
| Directors | 30.2% | 69.8% | 33 |
| Senior management | 32.3% | 67.7% | 68 |
| Management | 57.6% | 42.4% | 144 |
| Senior Professionals | 51.2% | 48.8% | 539 |
| Professionals | 72.9% | 27.1% | 604 |
| Administrative staff / Manufacturing operators | 44.7% | 55.3% | 1,094 |
| Total | 53.1% | 46.9% | 2,487 |
| AVERAGE WORKFORCE BY PROFESSIONAL CATEGORY AND TYPE OF CONTRACT | ||||||
| 2023 | 2022 | |||||
| Permanent | Temporary | Total | Permanent | Temporary | Total | |
| Executives | 121 | 1 | 122 | 126 | 0 | 126 |
| Directors | 445 | 4 | 449 | 469 | 3 | 472 |
| Senior management | 553 | 3 | 556 | 568 | 4 | 572 |
| Management | 1,260 | 11 | 1,270 | 1,331 | 7 | 1,338 |
| Senior Professionals | 1,968 | 17 | 1,986 | 1,998 | 19 | 2,016 |
| Professionals | 2,656 | 44 | 2,700 | 2,692 | 61 | 2,753 |
| Administrative staff / Manufacturing operators | 12,766 | 170 | 12,936 | 14,997 | 175 | 15,172 |
| Total | 19,769 | 250 | 20,019 | 22,181 | 268 | 22,450 |
| AVERAGE WORKFORCE BY PROFESSIONAL CATEGORY AND TYPE OF CONTRACT - biotest | |||
| 2023 | |||
| Permanent | Temporary | Total | |
| Executives | 6 | 0 | 6 |
| Directors | 33 | 0 | 33 |
| Senior management | 68 | 0 | 68 |
| Management | 139 | 5 | 144 |
| Senior Professionals | 509 | 30 | 539 |
| Professionals | 550 | 54 | 604 |
| Administrative staff / Manufacturing operators | 1,030 | 64 | 1,094 |
| Total | 2,335 | 153 | 2,488 |
| AVERAGE WORKFORCE BY PROFESSIONAL CATEGORY AND WORKING HOURS | ||||||
| 2023 | 2022 | |||||
| Full time | Part time | Total | Full time | Part time | Total | |
| Executives | 119 | 3 | 122 | 122 | 4 | 126 |
| Directors | 435 | 14 | 449 | 455 | 17 | 472 |
| Senior management | 546 | 10 | 556 | 558 | 14 | 572 |
| Management | 1,224 | 46 | 1,270 | 1,294 | 44 | 1,338 |
| Senior Professionals | 1,928 | 58 | 1,986 | 1,949 | 67 | 2,016 |
| Professionals | 2,595 | 105 | 2,700 | 2,668 | 84 | 2,753 |
| Administrative staff / Manufacturing operators | 12,241 | 695 | 12,936 | 14,370 | 802 | 15,172 |
| Total | 19,087 | 931 | 20,019 | 21,417 | 1,033 | 22,450 |
| AVERAGE WORKFORCE BY PROFESSIONAL CATEGORY AND WORKING HOURS - BIOTEST | |||
| 2023 | |||
| Full time | Part time | Total | |
| Executives | 6 | 0 | 6 |
| Directors | 31 | 2 | 33 |
| Senior management | 57 | 11 | 68 |
| Management | 120 | 24 | 144 |
| Senior Professionals | 422 | 117 | 539 |
| Professionals | 465 | 140 | 604 |
| Administrative staff / Manufacturing operators | 918 | 175 | 1,094 |
| Total | 2,018 | 469 | 2,487 |
| AVERAGE WORKFORCE BY PROFESSIONAL CATEGORY AND AGE | |||||||||
| 2023 | 2022 | ||||||||
| <30 | 30-50 | >50 | Total | <30 | 30-50 | >50 | Total | ||
| Executives | 0.0% | 41.8% | 58.2% | 122 | 0.0% | 36.9% | 63.1% | 100.0% | |
| Directors | 0.2% | 46.6% | 53.2% | 449 | 0.4% | 45.5% | 54.1% | 100.0% | |
| Senior management | 0.5% | 54.9% | 44.6% | 556 | 0.6% | 54.2% | 45.2% | 100.0% | |
| Management | 3.0% | 64.7% | 32.2% | 1,270 | 3.0% | 65.5% | 31.6% | 100.0% | |
| Senior Professionals | 8.6% | 63.1% | 28.4% | 1,986 | 8.5% | 64.5% | 27.0% | 100.0% | |
| Professionals | 13.7% | 64.6% | 21.7% | 2,700 | 13.9% | 65.5% | 20.5% | 100.0% | |
| Administrative staff / Manufacturing operators | 35.4% | 47.6% | 17.1% | 12,936 | 37.0% | 47.2% | 15.8% | 100.0% | |
| Total | 25.7% | 52.6% | 21.6% | 20,019 | 27.7% | 52.1% | 20.2% | 100.0% | |
| AVERAGE WORKFORCE BY PROFESSIONAL CATEGORY AND AGE - biotest | ||||
| 2023 | ||||
| <30 | 30-50 | >50 | Total | |
| Executives | 0.0% | 33.8% | 66.2% | 6 |
| Directors | 0.0% | 30.5% | 69.5% | 33 |
| Senior management | 1.0% | 40.9% | 58.2% | 68 |
| Management | 1.5% | 51.7% | 46.9% | 144 |
| Senior Professionals | 8.2% | 65.1% | 26.7% | 539 |
| Professionals | 20.2% | 58.2% | 21.6% | 604 |
| Administrative staff / Manufacturing operators | 28.0% | 47.3% | 24.7% | 1,094 |
| Total | 19.1% | 53.6% | 27.3% | 2,487 |
| AVERAGE WORKFORCE BY COUNTRY AND GENDER | ||||||||
| 2023 | 2022 | |||||||
| Women | Men | Non-binary and undeclared | Total | Women | Men | Non-binary and undeclared | Total | |
| U.S. | 8,000 | 5,106 | 38 | 13,143 | 9,965 | 5,679 | 26 | 15,644 |
| Spain | 1,818 | 2,275 | 1 | 4,095 | 1,798 | 2,284 | 0 | 4,082 |
| Rest of the world | 1,641 | 1,132 | 8 | 2,781 | 1,599 | 1,099 | 0 | 2,699 |
| Total | 11,459 | 8,513 | 47 | 20,019 | 13,362 | 9,062 | 26 | 22,450 |
| AVERAGE WORKFORCE BY COUNTRY AND GENDER - biotest | |||
| 2023 | |||
| Women | Men | Total | |
| Germany | 904 | 1,046 | 1,950 |
| Spain | 0 | 0 | 0 |
| U.S. | 0 | 0 | 0 |
| Rest of the world | 418 | 119 | 537 |
| Total | 1,322 | 1,166 | 2,487 |
Workforce distribution
| WORKFORCE DISTRIBUTION BY COUNTRY | ||||||
| 2023 | % | 2022 | % | 2021 | % | |
| Spain | 4,181 | 19.8% | 4,217 | 17.6% | 4,163 | 17.9% |
| U.S. | 13,918 | 65.8% | 16,734 | 69.9% | 16,306 | 70.2% |
| Rest of the world | 3,045 | 14.4% | 2,996 | 12.5% | 2,765 | 11.9% |
| Total | 21,144 | 100.0% | 23,947 | 100.0% | 23,234 | 100.0% |
| WORKFORCE DISTRIBUTION BY COUNTRY - biotest | ||||
| 2023 | % | 2022 | % | |
| Germany | 2,045 | 78.7% | 1,796 | 75.9% |
| Spain | 0 | 0 | 7 | 0.3% |
| U.S. | 0 | 0 | 0 | 0.0% |
| Rest of the world | 552 | 21.3% | 564 | 23.8% |
| Total | 2,597 | 100.0% | 2,367 | 100.0% |
| WORKFORCE DISTRIBUTION BY AGE | |||
| 2023 | 2022 | 2021 | |
| <30 | 5,702 | 6,859 | 6,513 |
| 30-50 | 10,931 | 12,241 | 11,997 |
| >50 | 4,511 | 4,847 | 4,724 |
| Total | 21,144 | 23,947 | 23,234 |
| WORKFORCE DISTRIBUTION BY AGE - biotest | ||
| 2023 | 2022 | |
| <30 | 506 | 434 |
| 30-50 | 1,393 | 1,272 |
| >50 | 698 | 661 |
| Total | 2,597 | 2,367 |
| WORKFORCE DISTRIBUTION BY REGION AND TYPE OF CONTRACT | |||||||||
| 2023 | 2022 | 2021 | |||||||
| Permanent | Temporary | Total | Permanent | Temporary | Total | Permanent | Temporary | Total | |
| U.S. | 13,914 | 4 | 13,918 | 16,725 | 9 | 16,734 | 16,299 | 7 | 16,306 |
| Europe | 6,402 | 280 | 6,682 | 6,356 | 318 | 6,674 | 6,099 | 285 | 6,384 |
| Rest of the world | 534 | 10 | 544 | 530 | 9 | 539 | 535 | 9 | 544 |
| Total | 20,850 | 294 | 21,144 | 23,611 | 336 | 23,947 | 22,933 | 301 | 23,234 |
| % | 99% | 1% | 100% | 98.6% | 1.4% | 100.0% | 98.7% | 1.3% | 100.0% |
| WORKFORCE DISTRIBUTION BY REGION AND TYPE OF CONTRACT - biotest | ||||||
| 2023 | 2022 | |||||
| Permanent | Temporary | Total | Permanent | Temporary | Total | |
| U.S. | 0 | 0 | 0 | 0 | 0 | 0 |
| Europe | 2,432 | 165 | 2,597 | 2,156 | 209 | 2,365 |
| Rest of the world | 0 | 0 | 0 | 2 | 0 | 2 |
| Total | 2,432 | 165 | 2,597 | 2,158 | 209 | 2,367 |
| % | 94% | 6% | 100% | 91% | 9% | 100% |
| WORKFORCE DISTRIBUTION BY GENDER AND TYPE OF CONTRACT | |||||||||
| 2023 | 2022 | 2021 | |||||||
| Permanent | Temporary | Total | Permanent | Temporary | Total | Permanent | Temporary | Total | |
| Women | 12,096 | 163 | 12,259 | 14,206 | 182 | 14,388 | 13,831 | 146 | 13,977 |
| Men | 8,695 | 131 | 8,826 | 9,366 | 154 | 9,520 | 9,101 | 155 | 9,256 |
| Non-binary and undeclared | 59 | 0 | 59 | 39 | 0 | 39 | 1 | 0 | 1 |
| Total | 20,850 | 294 | 21,144 | 23,611 | 336 | 23,947 | 22,933 | 301 | 23,234 |
| % | 98.6% | 1.4% | 100.0% | 98.6% | 1.4% | 100.0% | 98.7% | 1.3% | 100.0% |
| WORKFORCE DISTRIBUTION BY GENDER AND TYPE OF CONTRACT - biotest | ||||||
| 2023 | 2022 | |||||
| Permanent | Temporary | Total | Permanent | Temporary | Total | |
| Women | 1,247 | 134 | 1,381 | 1,112 | 157 | 1,269 |
| Men | 1,185 | 31 | 1,216 | 1,046 | 52 | 1,098 |
| Total | 2,432 | 165 | 2,597 | 2,158 | 209 | 2,367 |
| % | 93.6% | 6.4% | 100.0% | 91.2% | 8.8% | 100.0% |
| WORKFORCE DISTRIBUTION BY GENDER AND WORKING HOURS | |||||||||
| 2023 | 2022 | 2021 | |||||||
| Full time | Part time | Total | Full time | Part time | Total | Full time | Part time | Total | |
| Women | 11,266 | 993 | 12,259 | 13,266 | 1,122 | 14,388 | 12,844 | 1,133 | 13,977 |
| Men | 8,505 | 321 | 8,826 | 9,168 | 352 | 9,520 | 8,899 | 357 | 9,256 |
| Non-binary and undeclared | 56 | 3 | 59 | 36 | 3 | 39 | 1 | 0 | 1 |
| Total | 19,827 | 1,317 | 21,144 | 22,470 | 1,477 | 23,947 | 21,744 | 1,490 | 23,234 |
| % | 93.8% | 6.2% | 100.0% | 93.8% | 6.2% | 100.0% | 93.6% | 6.4% | 100.0% |
| WORKFORCE DISTRIBUTION BY GENDER AND WORKING HOURS - biotest | ||||||
| 2023 | 2022 | |||||
| Full time | Part time | Total | Full time | Part time | Total | |
| Women | 984 | 397 | 1,381 | 912 | 357 | 1,269 |
| Men | 1,124 | 92 | 1,216 | 1,030 | 68 | 1,098 |
| Total | 2,108 | 489 | 2,597 | 1,942 | 425 | 2,367 |
| % | 81.2% | 18.8% | 100.0% | 82.0% | 18.0% | 100.0% |
| WORKFORCE DISTRIBUTION BY AGE AND WORKING HOURS | ||||||||||||||
| 2023 | 2022 | 2021 | ||||||||||||
| <30 | 30-50 | >50 | Total | <30 | 30-50 | >50 | Total | <30 | 30-50 | >50 | Total | |||
| Full time | 5,196 | 10,363 | 4,268 | 19,827 | 6,243 | 11,648 | 4,579 | 22,470 | 5,852 | 11,418 | 4,474 | 21,744 | ||
| Part time | 506 | 568 | 243 | 1,317 | 616 | 593 | 268 | 1,477 | 661 | 579 | 250 | 1,490 | ||
| Total | 5,702 | 10,931 | 4,511 | 21,144 | 6,859 | 12,241 | 4,847 | 23,947 | 6,513 | 11,997 | 4,724 | 23,234 | ||
| WORKFORCE DISTRIBUTION BY AGE AND WORKING HOURS - biotest | |||||||||
| 2023 | 2022 | ||||||||
| <30 | 30-50 | >50 | Total | <30 | 30-50 | >50 | Total | ||
| Full time | 426 | 1,140 | 542 | 2,108 | 377 | 1,044 | 521 | 1,942 | |
| Part time | 80 | 253 | 156 | 489 | 57 | 228 | 140 | 425 | |
| Total | 506 | 1,393 | 698 | 2,597 | 434 | 1,272 | 661 | 2,367 | |
| WORKFORCE DISTRIBUTION BY AGE AND TYPE OF CONTRACT | ||||||||||||
| 2023 | 2022 | 2021 | ||||||||||
| <30 | 30-50 | >50 | Total | <30 | 30-50 | >50 | Total | <30 | 30-50 | >50 | Total | |
| Permanent | 5,628 | 10,814 | 4,408 | 20,850 | 6,763 | 12,113 | 4,735 | 23,611 | 6,425 | 11,880 | 4,628 | 22,933 |
| Temporary | 74 | 117 | 103 | 294 | 96 | 128 | 112 | 336 | 88 | 117 | 96 | 301 |
| Total | 5,702 | 10,931 | 4,511 | 21,144 | 6,859 | 12,241 | 4,847 | 23,947 | 6,513 | 11,997 | 4,724 | 23,234 |
| WORKFORCE DISTRIBUTION BY AGE AND TYPE OF CONTRACT - biotest | ||||||||
| 2023 | 2022 | |||||||
| <30 | 30-50 | >50 | Total | <30 | 30-50 | >50 | Total | |
| Permanent | 434 | 1,318 | 680 | 2,432 | 346 | 1,173 | 639 | 2,158 |
| Temporary | 72 | 75 | 18 | 165 | 88 | 99 | 22 | 209 |
| Total | 506 | 1,393 | 698 | 2,597 | 434 | 1,272 | 661 | 2,367 |
| WORKFORCE DISTRIBUTION BY PROFESSIONAL CATEGORY AND GENDER | ||||||||||||
| 2023 | 2022 | 2021 | ||||||||||
| Women | Men | Non-binary and undeclared | Total | Women | Men | Non-binary and undeclared | Total | Women | Men | Non-binary and undeclared | Total | |
| Executives | 23.3% | 76.7% | 0.0% | 120 | 23.8% | 76.2% | 0.0% | 122 | 28.2% | 71.8% | 0.0% | 149 |
| Directors | 38.8% | 61.2% | 0.0% | 443 | 40.7% | 58.9% | 0.4% | 484 | 37.6% | 62.4% | 0.0% | 471 |
| Senior management | 41.6% | 58.4% | 0.0% | 553 | 38.8% | 61.2% | 0.0% | 565 | 41.2% | 58.8% | 0.0% | 582 |
| Management | 47.0% | 53.0% | 0.0% | 1,266 | 47.1% | 52.7% | 0.1% | 1,337 | 46.7% | 53.3% | 0.0% | 1,302 |
| Senior Professionals | 48.3% | 51.6% | 0.1% | 1,975 | 47.4% | 52.6% | 0.0% | 2,054 | 47.5% | 52.5% | 0.0% | 2,071 |
| Professionals | 52.7% | 47.2% | 0.1% | 2,701 | 52.4% | 47.6% | 0.1% | 2,799 | 52.4% | 47.6% | 0.0% | 2,806 |
| Administrative staff / Manufacturing operators | 62.9% | 36.7% | 0.4% | 14,086 | 65.6% | 34.2% | 0.2% | 16,586 | 66.0% | 34.0% | 0.0% | 15,853 |
| Total | 58.0% | 41.7% | 0.3% | 21,144 | 60.1% | 39.8% | 0.2% | 23,947 | 60.2% | 39.8% | 0.0% | 23,234 |
| WORKFORCE DISTRIBUTION BY PROFESSIONAL CATEGORY AND GENDER - biotest | ||||||
| 2023 | 2022 | |||||
| Women | Men | Total | Women | Men | Total | |
| Executives | 33.3% | 66.7% | 6 | 29.7% | 70.3% | 37 |
| Directors | 29.4% | 70.6% | 34 | 46.9% | 53.1% | 209 |
| Senior management | 32.9% | 67.1% | 70 | 52.7% | 47.3% | 311 |
| Management | 58.3% | 41.7% | 144 | 53.4% | 46.6% | 191 |
| Senior Professionals | 52.1% | 47.9% | 562 | 55.2% | 44.8% | 279 |
| Professionals | 72.7% | 27.3% | 626 | 80.6% | 19.4% | 330 |
| Administrative staff / Manufacturing operators | 44.5% | 55.5% | 1,155 | 46.9% | 53.1% | 1,010 |
| Total | 53.2% | 46.8% | 2,597 | 53.6% | 46.4% | 2,367 |
| WORKFORCE DISTRIBUTION BY PROFESSIONAL CATEGORY AND TYPE OF CONTRACT | |||||||||
| 2023 | 2022 | 2021 | |||||||
| Permanent | Temporary | Total | Permanent | Temporary | Total | Permanent | Temporary | Total | |
| Executives | 115 | 5 | 120 | 121 | 1 | 122 | 148 | 1 | 149 |
| Directors | 440 | 3 | 443 | 481 | 3 | 484 | 467 | 4 | 471 |
| Senior management | 547 | 6 | 553 | 559 | 6 | 565 | 577 | 5 | 582 |
| Management | 1,248 | 18 | 1,266 | 1,318 | 19 | 1,337 | 1,289 | 13 | 1,302 |
| Senior Professionals | 1,955 | 20 | 1,975 | 2,033 | 21 | 2,054 | 2,050 | 21 | 2,071 |
| Professionals | 2,647 | 54 | 2,701 | 2,728 | 71 | 2,799 | 2,723 | 83 | 2,806 |
| Administrative staff / Manufacturing operators | 13,898 | 188 | 14,086 | 16,371 | 215 | 16,586 | 15,679 | 174 | 15,853 |
| Total | 20,850 | 294 | 21,144 | 23,611 | 336 | 23,947 | 22,933 | 301 | 23,234 |
| WORKFORCE DISTRIBUTION BY PROFESSIONAL CATEGORY AND TYPE OF CONTRACT - biotest | ||||||
| 2023 | 2022 | |||||
| Women | Men | Total | Women | Men | Total | |
| Executives | 6 | 0 | 6 | 37 | 0 | 37 |
| Directors | 34 | 0 | 34 | 203 | 6 | 209 |
| Senior management | 69 | 1 | 70 | 281 | 30 | 311 |
| Management | 140 | 4 | 144 | 181 | 10 | 191 |
| Senior Professionals | 530 | 32 | 562 | 262 | 17 | 279 |
| Professionals | 560 | 66 | 626 | 278 | 52 | 330 |
| Administrative staff / Manufacturing operators | 1,093 | 62 | 1,155 | 916 | 94 | 1,010 |
| Total | 2,432 | 165 | 2,597 | 2,158 | 209 | 2,367 |
| WORKFORCE DISTRIBUTION BY PROFESSIONAL CATEGORY AND AGE | ||||||||||||
| 2023 | 2022 | 2021 | ||||||||||
| <30 | 30-50 | >50 | Total | <30 | 30-50 | >50 | Total | <30 | 30-50 | >50 | Total | |
| Executives | 0.0% | 40.8% | 59.2% | 120 | 0.0% | 36.9% | 63.1% | 122 | 0.0% | 38.9% | 61.1% | 149 |
| Directors | 0.0% | 44.7% | 55.3% | 443 | 0.2% | 44.0% | 55.8% | 484 | 0.6% | 42.9% | 56.5% | 471 |
| Senior management | 0.2% | 55.5% | 44.3% | 553 | 0.4% | 54.0% | 45.7% | 565 | 0.9% | 51.7% | 47.4% | 582 |
| Management | 2.7% | 64.1% | 33.3% | 1,266 | 2.2% | 64.9% | 32.8% | 1,337 | 2.8% | 64.0% | 33.2% | 1,302 |
| Senior Professionals | 7.8% | 63.4% | 28.8% | 1,975 | 7.9% | 64.0% | 28.1% | 2,054 | 8.1% | 64.9% | 27.0% | 2,071 |
| Professionals | 13.4% | 64.1% | 22.5% | 2,701 | 13.7% | 64.8% | 21.5% | 2,799 | 13.6% | 65.6% | 20.8% | 2,806 |
| Administrative staff / Manufacturing operators | 36.6% | 46.7% | 16.7% | 14,086 | 37.9% | 46.3% | 15.8% | 16,586 | 37.3% | 46.8% | 15.9% | 15,853 |
| Total | 27.0% | 51.7% | 21.3% | 21,144 | 28.6% | 51.1% | 20.2% | 23,947 | 28.0% | 51.6% | 20.3% | 23,234 |
| WORKFORCE DISTRIBUTION BY PROFESSIONAL CATEGORY AND AGE - biotest | |||||||||
| 2023 | 2022 | ||||||||
| <30 | 30-50 | >50 | Total | <30 | 30-50 | >50 | Total | ||
| Executives | 0.0% | 33.3% | 66.7% | 6 | 0.0% | 32.4% | 67.6% | 37 | |
| Directors | 0.0% | 32.4% | 67.6% | 34 | 0.5% | 49.3% | 50.2% | 209 | |
| Senior management | 0.0% | 44.3% | 55.7% | 70 | 9.6% | 59.8% | 30.5% | 311 | |
| Management | 2.1% | 51.4% | 46.5% | 144 | 3.1% | 70.7% | 26.2% | 191 | |
| Senior Professionals | 9.1% | 64.1% | 26.9% | 562 | 14.3% | 68.1% | 17.6% | 279 | |
| Professionals | 20.9% | 57.7% | 21.4% | 626 | 23.9% | 52.4% | 23.6% | 330 | |
| Administrative staff / Manufacturing operators | 27.8% | 48.0% | 24.2% | 1,155 | 27.5% | 46.8% | 25.6% | 1,010 | |
| Total | 19.5% | 53.6% | 26.9% | 2,597 | 18.3% | 53.7% | 27.9% | 2,367 | |
| WORKFORCE DISTRIBUTION BY PROFESSIONAL CATEGORY AND WORKING HOURS | |||||||||
| 2023 | 2022 | 2021 | |||||||
| Full time | Part time | Total | Full time | Part time | Total | Full time | Part time | Total | |
| Executives | 118 | 2 | 120 | 122 | 0 | 122 | 148 | 1 | 149 |
| Directors | 416 | 27 | 443 | 449 | 35 | 484 | 433 | 38 | 471 |
| Senior management | 550 | 3 | 553 | 557 | 8 | 565 | 577 | 5 | 582 |
| Management | 1,234 | 32 | 1,266 | 1,303 | 34 | 1,337 | 1,273 | 29 | 1,302 |
| Senior Professionals | 1,936 | 39 | 1,975 | 2,001 | 53 | 2,054 | 2,014 | 57 | 2,071 |
| Professionals | 2,581 | 120 | 2,701 | 2,696 | 103 | 2,799 | 2,702 | 104 | 2,806 |
| Administrative staff / Manufacturing operators | 12,992 | 1,094 | 14,086 | 15,342 | 1,244 | 16,586 | 14,597 | 1,256 | 15,853 |
| Total | 19,827 | 1,317 | 21,144 | 22,470 | 1,477 | 23,947 | 21,744 | 1,490 | 23,234 |
| WORKFORCE DISTRIBUTION BY PROFESSIONAL CATEGORY AND WORKING HOURS - biotest | ||||||
| 2023 | 2022 | |||||
| Full time | Part time | Total | Full time | Part time | Total | |
| Executives | 6 | 0 | 6 | 34 | 3 | 37 |
| Directors | 32 | 2 | 34 | 180 | 29 | 209 |
| Senior management | 57 | 13 | 70 | 229 | 82 | 311 |
| Management | 119 | 25 | 144 | 172 | 19 | 191 |
| Senior Professionals | 435 | 127 | 562 | 220 | 59 | 279 |
| Professionals | 485 | 141 | 626 | 260 | 70 | 330 |
| Administrative staff / Manufacturing operators | 974 | 181 | 1,155 | 847 | 163 | 1,010 |
| Total | 2,108 | 489 | 2,597 | 1,942 | 425 | 2,367 |
| WORKFORCE DISTRIBUTION BY GENDER AND COUNTRY | ||||||||||||
| 2023 | 2022 | 2021 | ||||||||||
| Women | Men | Non-binary and undeclared | Total | Women | Men | Non-binary and undeclared | Total | Women | Men | Non-binary and undeclared | Total | |
| U.S. | 8,518 | 5,341 | 59 | 13,918 | 10,655 | 6,041 | 38 | 16,734 | 10,424 | 5,881 | 1 | 16,306 |
| Spain | 1,891 | 2,290 | 0 | 4,181 | 1,877 | 2,340 | 0 | 4,217 | 1,867 | 2,296 | 0 | 4,163 |
| Rest of the world | 1,850 | 1,195 | 0 | 3,045 | 1,856 | 1,139 | 1 | 2,996 | 1,686 | 1,079 | 0 | 2,765 |
| Total | 12,259 | 8,826 | 59 | 21,144 | 14,388 | 9,520 | 39 | 23,947 | 13,977 | 9,256 | 1 | 23,234 |
| WORKFORCE DISTRIBUTION BY GENDER AND COUNTRY - biotest | ||||||
| 2023 | 2022 | |||||
| Women | Men | Total | Women | Men | Total | |
| U.S. | 0 | 0 | 0 | 0 | 0 | 0 |
| Germany | 949 | 1,096 | 2,045 | 840 | 956 | 1,796 |
| Spain | 0 | 0 | 0 | 5 | 2 | 7 |
| Rest of the world | 432 | 120 | 552 | 424 | 140 | 564 |
| Total | 1,381 | 1,216 | 2,597 | 1,269 | 1,098 | 2,367 |
Joiners and leavers
| EMPLOYEE NEW HIRES | ||||||||||||
| 2023 | 2022 | 2021 | ||||||||||
| Women | Men | Non-binary and undeclared | Total | Women | Men | Non-binary and undeclared | Total | Women | Men | Non-binary and undeclared | Total | |
| Total number of employees | 12,259 | 8,826 | 59 | 21,144 | 14,388 | 9,520 | 39 | 23,947 | 13,977 | 9,256 | 1 | 23,234 |
| Joiners* | 4,160 | 2,037 | 49 | 6,246 | 8,296 | 3,208 | 64 | 11,568 | 7,073 | 2,306 | 0 | 9,379 |
| Ratio (joiners/number of employees) | 33.9% | 23.1% | 83.1% | 29.5% | 57.7% | 33.7% | 164.1% | 48.3% | 50.6% | 24.9% | 0.0% | 40.4% |
*Note: Employees from acquisitions on the acquisition date are not included as joiners. Subsequent increases in headcount do.
| EMPLOYEE NEW HIRES - biotest | ||||||
| 2023 | 2022 | |||||
| Women | Men | Total | Women | Men | Total | |
| Total number of employees | 1,381 | 1,216 | 2,597 | 1,269 | 1,098 | 2,367 |
| Joiners | 359 | 212 | 571 | 362 | 220 | 582 |
| Ratio (joiners/number of employees) | 26.0% | 17.4% | 22.0% | 28.5% | 20.0% | 24.6% |
| EMPLOYEE TURNOVER | ||||||||||||
| 2023 | 2022 | 2021 | ||||||||||
| Women | Men | Non-binary and undeclared | Total | Women | Men | Non-binary and undeclared | Total | Women | Men | Non-binary and undeclared | Total | |
| Total number of employees | 12,259 | 8,826 | 59 | 21,144 | 14,388 | 9,520 | 39 | 23,947 | 13,977 | 9,256 | 1 | 23,234 |
| Leavers* | 6,165 | 2,695 | 34 | 8,894 | 7,666 | 2,885 | 31 | 10,582 | 7,673 | 2,814 | 0 | 10,487 |
| Ratio (leavers/number of employees) | 50.3% | 30.5% | 57.6% | 42.1% | 53.3% | 30.3% | 79.5% | 44.2% | 54.9% | 30.4% | 0.0% | 45.1% |
| EMPLOYEE TURNOVER - biotest | ||||||
| 2023 | 2022 | |||||
| Women | Men | Total | Women | Men | Total | |
| Total number of employees | 1,381 | 1,216 | 2,597 | 1,269 | 1,098 | 2,367 |
| Leavers | 218 | 95 | 313 | 227 | 105 | 332 |
| Ratio (leavers/number of employees) | 15.8% | 7.8% | 12.1% | 17.9% | 9.6% | 14.0% |
| LEAVERS BY PROFESSIONAL CATEGORY | ||
| 2023 | 2022 | |
| Executives | 27 | 26 |
| Directors | 111 | 80 |
| Senior management | 66 | 75 |
| Management | 233 | 186 |
| Senior Professionals | 312 | 308 |
| Professionals | 564 | 537 |
| Administrative staff / Manufacturing operators | 7,581 | 9,370 |
| Total | 8,894 | 10,582 |
| LEAVERS BY PROFESSIONAL CATEGORY - BIOTEST | ||
| 2023 | 2022 | |
| Executives | 2 | 3 |
| Directors | 1 | 15 |
| Senior management | 7 | 43 |
| Management | 13 | 17 |
| Senior Professionals | 54 | 17 |
| Professionals | 65 | 60 |
| Administrative staff / Manufacturing operators | 171 | 177 |
| Total | 313 | 332 |
| VOLUNTARY AND NON-VOLUNTARY LEAVES | ||||||
| 2023 | 2022 | |||||
| Voluntary | Non-voluntary | Total | Voluntary | Non-voluntary | Total | |
| Executives | 8% | 14% | 23% | 7% | 15% | 21% |
| Directors | 8% | 17% | 25% | 8% | 9% | 17% |
| Senior management | 4% | 8% | 12% | 8% | 6% | 13% |
| Management | 8% | 11% | 18% | 8% | 5% | 14% |
| Senior Professionals | 8% | 8% | 16% | 10% | 5% | 15% |
| Professionals | 10% | 10% | 21% | 13% | 7% | 19% |
| Administrative staff / Manufacturing operators | 36% | 18% | 54% | 47% | 19% | 56% |
| Total | 27% | 15% | 42% | 36% | 9% | 44% |
| VOLUNTARY AND NON-VOLUNTARY LEAVES - biotest | ||||||
| 2023 | ||||||
| Voluntary | Non-voluntary | Total | ||||
| Executives | 33% | 0% | 33% | |||
| Directors | 3% | 0% | 3% | |||
| Senior management | 6% | 4% | 10% | |||
| Management | 6% | 3% | 9% | |||
| Senior Professionals | 8% | 2% | 10% | |||
| Professionals | 9% | 1% | 10% | |||
| Administrative staff / Manufacturing operators | 11% | 3% | 15% | |||
| Total | 10% | 3% | 12% | |||
| DISMISSALS BY COUNTRY AND GENDER | ||||||||||||
| 2023 | 2022 | 2021 | ||||||||||
| Women | Men | Non-binary and undeclared | Total | Women | Men | Non-binary and undeclared | Total | Women | Men | Total | ||
| Spain | 55 | 79 | 0 | 134 | 25 | 40 | 0 | 65 | 83 | 47 | 130 | |
| U.S. | 1,706 | 860 | 12 | 2,578 | 977 | 500 | 8 | 1,485 | 455 | 254 | 709 | |
| ROW | 105 | 66 | 0 | 171 | 52 | 23 | 0 | 75 | 118 | 78 | 196 | |
| Total | 1,866 | 1,005 | 12 | 2,883 | 1,054 | 563 | 8 | 1,625 | 656 | 379 | 1,035 | |
| % | 64.7% | 34.9% | 0.4% | 100.0% | 64.9% | 34.6% | 0.5% | 100.0% | 63.4% | 36.6% | 100.0% | |
| DISMISSALS BY COUNTRY AND GENDER - BIOTEST | ||||||
| 2023 | 2022 | |||||
| Women | Men | Total | Women | Men | Total | |
| Germany | 29 | 20 | 49 | 14 | 17 | 31 |
| Spain | 0 | 0 | 0 | 0 | 0 | 0 |
| U.S. | 0 | 0 | 0 | 0 | 0 | 0 |
| Rest of the world | 16 | 1 | 17 | 25 | 6 | 31 |
| Total | 45 | 21 | 66 | 39 | 23 | 62 |
| % | 68.2% | 31.8% | 100.0% | 62.9% | 37.1% | 100.0% |
| DISMISSALS BY PROFESSIONAL CATEGORY AND COUNTRY | |||||||||
| 2023 | 2022 | 2021 | |||||||
| Spain | U.S. | ROW | Spain | U.S. | ROW | Spain | U.S. | ROW | |
| Executives | 3 | 9 | 0 | 2 | 10 | 0 | 0 | 4 | 0 |
| Directors | 7 | 57 | 3 | 3 | 17 | 6 | 1 | 13 | 3 |
| Senior management | 14 | 16 | 2 | 9 | 8 | 2 | 1 | 8 | 4 |
| Management | 18 | 96 | 5 | 13 | 35 | 4 | 3 | 12 | 14 |
| Senior Professionals | 24 | 83 | 14 | 9 | 53 | 5 | 7 | 22 | 20 |
| Professionals | 21 | 169 | 41 | 6 | 114 | 13 | 9 | 32 | 42 |
| Administrative staff / Manufacturing operators | 47 | 2,148 | 106 | 23 | 1,248 | 45 | 109 | 618 | 113 |
| Total | 134 | 2,578 | 171 | 65 | 1,485 | 75 | 130 | 709 | 196 |
| DISMISSALS BY PROFESSIONAL CATEGORY AND COUNTRY - biotest | ||||||||
| 2023 | 2022 | |||||||
| Germany | Spain | U.S. | ROW | Germany | Spain | U.S. | ROW | |
| Executives | 0 | 0 | 0 | 0 | 1 | 0 | 0 | 0 |
| Directors | 0 | 0 | 0 | 0 | 3 | 0 | 0 | 0 |
| Senior management | 3 | 0 | 0 | 0 | 0 | 0 | 0 | 2 |
| Management | 4 | 0 | 0 | 1 | 1 | 0 | 0 | 7 |
| Senior Professionals | 7 | 0 | 0 | 2 | 1 | 0 | 0 | 0 |
| Professionals | 3 | 0 | 0 | 6 | 1 | 0 | 0 | 12 |
| Administrative staff / Manufacturing operators | 32 | 0 | 0 | 8 | 24 | 0 | 0 | 10 |
| Total | 49 | 0 | 0 | 17 | 31 | 0 | 0 | 31 |
| DISMISSALS BY COUNTRY AND AGE | ||||||||||||
| 2023 | 2022 | 2021 | ||||||||||
| <30 | 30-50 | >50 | Total | <30 | 30-50 | >50 | Total | <30 | 30-50 | >50 | Total | |
| Spain | 13 | 80 | 41 | 134 | 4 | 37 | 24 | 65 | 12 | 99 | 19 | 130 |
| U.S. | 962 | 1,226 | 390 | 2,578 | 606 | 680 | 199 | 1,485 | 272 | 339 | 98 | 709 |
| ROW | 43 | 90 | 38 | 171 | 14 | 34 | 27 | 75 | 46 | 102 | 48 | 196 |
| Total | 1,018 | 1,396 | 469 | 2,883 | 624 | 751 | 250 | 1,625 | 330 | 540 | 165 | 1,035 |
| % | 35.3% | 48.4% | 16.3% | 100.0% | 38.4% | 46.2% | 15.4% | 100.0% | 31.9% | 52.2% | 15.9% | 100.0% |
| DISMISSALS BY COUNTRY AND AGE - biotest | ||||||||
| 2023 | 2022 | |||||||
| <30 | 30-50 | >50 | Total | <30 | 30-50 | >50 | Total | |
| Germany | 17 | 14 | 18 | 49 | 11 | 13 | 7 | 31 |
| Spain | 0 | 0 | 0 | 0 | 0 | 0 | 0 | 0 |
| U.S. | 0 | 0 | 0 | 0 | 0 | 0 | 0 | 0 |
| ROW | 9 | 6 | 2 | 17 | 8 | 16 | 7 | 31 |
| Total | 26 | 20 | 20 | 66 | 19 | 29 | 14 | 62 |
| % | 39.4% | 30.3% | 30.3% | 100.0% | 30.6% | 46.8% | 22.6% | 100.0% |
Absenteeism
| BREAKDOWN OF ABSEENTISM BY TYPE AND COUNTRY | ||||||||||||
| 2023 | 2022 | 2021 | ||||||||||
| Spain | U.S. | ROW | Total | Spain | U.S. | ROW | Total | Spain | U.S. | ROW | Total | |
| Illness | 344,969 | 564,089 | 291,370 | 1,200,427 | 380,924 | 586,913 | 315,499 | 1,283,336 | 370,163 | 548,671 | 234,421 | 1,153,255 |
| Work accident | 22,970 | 19,955 | 4,206 | 47,130 | 66,324 | 36,928 | 3,494 | 106,746 | 55,485 | 40,059 | 3,714 | 99,258 |
| Maternity / Paternity | 101,864 | 58,141 | 112,059 | 272,064 | 127,633 | 112,717 | 135,339 | 375,689 | 94,018 | 157,978 | 120,017 | 372,013 |
| Paid leave | 62,124 | 1,821 | 28,627 | 92,572 | 50,080 | 120,422 | 36,336 | 206,838 | 83,644 | 259,507 | 18,002 | 361,153 |
| Unpaid leave | 2,725 | 123,032 | 5,888 | 131,646 | 1,582 | 177,047 | 26,371 | 205,000 | 1,958 | 193,785 | 16,322 | 212,065 |
| Total | 534,652 | 767,038 | 442,150 | 1,743,839 | 626,543 | 1,034,027 | 517,040 | 2,177,610 | 605,268 | 1,200,000 | 392,476 | 2,197,744 |
| BREAKDOWN OF ABSENTEEISM BY TYPE AND COUNTRY - biotest | ||||
| 2023 | 2022 | |||
| Germany | ROW | Total | Germany | |
| Illness | 265,158 | 29,752 | 294,910 | 239.233 |
| Work accident | 1,855 | 568 | 2,423 | 4.269 |
| Maternity / Paternity | 104,268 | 78,022 | 182,290 | 117.082 |
| Paid leave | 49,479 | 81,165 | 130,644 | 104.505 |
| Unpaid leave | 5,477 | 393 | 5,870 | 3.994 |
| Total | 426,237 | 189,900 | 616,137 | 469.083 |
| BREAKDOWN OF ABSEENTISM BY TYPE AND GENDER | ||||||
| 2023 | ||||||
| Women | Men | Non-binary and undeclared | Total | Women % | Men % | |
| Illness | 839,516 | 358,368 | 2,543 | 1,200,427 | 69.9% | 29.9% |
| Work accident | 20,016 | 27,114 | 0 | 47,130 | 42.5% | 57.5% |
| Maternity / Paternity | 192,076 | 79,846 | 143 | 272,064 | 70.6% | 29.3% |
| Paid leave | 50,834 | 41,735 | 3 | 92,572 | 54.9% | 45.1% |
| Unpaid leave | 79,661 | 51,984 | 0 | 131,646 | 60.5% | 39.5% |
| Total | 1,182,103 | 559,047 | 2,689 | 1,743,839 | 67.8% | 32.1% |
| BREAKDOWN OF ABSEENTISM BY TYPE AND GENDER | ||||||
| 2022 | ||||||
| Women | Men | Non-binary and undeclared | Total | Women % | Men % | |
| Illness | 905,342 | 377,063 | 932 | 1,283,337 | 70.5% | 29.4% |
| Work accident | 65,402 | 41,345 | 0 | 106,747 | 61.3% | 38.7% |
| Maternity / Paternity | 298,566 | 77,123 | 0 | 375,689 | 79.5% | 20.5% |
| Paid leave | 134,921 | 71,836 | 80 | 206,837 | 65.2% | 34.7% |
| Unpaid leave | 141,841 | 63,159 | 0 | 205,000 | 69.2% | 30.8% |
| Total | 1,546,072 | 630,526 | 1,012 | 2,177,610 | 71.0% | 29.0% |
| BREAKDOWN OF ABSEENTISM BY TYPE AND GENDER | |||||
| 2021 | |||||
| Women | Men | Total | Women % | Men % | |
| Illness | 802,452 | 350,803 | 1,153,255 | 69.6% | 30.4% |
| Work accident | 61,599 | 37,659 | 99,258 | 62.1% | 37.9% |
| Maternity / Paternity | 312,418 | 59,594 | 372,012 | 84.0% | 16.0% |
| Paid leave | 245,544 | 115,570 | 361,114 | 68.0% | 32.0% |
| Unpaid leave | 147,731 | 64,333 | 212,064 | 69.7% | 30.3% |
| Total | 1,569,744 | 627,959 | 2,197,703 | 71.4% | 28.6% |
| BREAKDOWN OF ABSEENTISM BY TYPE AND GENDER - biotest | |||||
| 2023 | |||||
| Women | Men | Total | Women % | Men % | |
| Illness | 156,490 | 138,420 | 294,910 | 53.1% | 46.9% |
| Work accident | 1,142 | 1,281 | 2,423 | 47.1% | 52.9% |
| Maternity / Paternity | 171,822 | 10,469 | 182,290 | 94.3% | 5.7% |
| Paid leave | 80,317 | 50,327 | 130,644 | 61.5% | 38.5% |
| Unpaid leave | 2,243 | 3,627 | 5,870 | 38.2% | 61.8% |
| Total | 412,013 | 204,124 | 616,137 | 66.9% | 33.1% |
| BREAKDOWN OF ABSEENTISM BY TYPE AND GENDER - biotest | |||||
| 2022 | |||||
| Women | Men | Total | Women % | Men % | |
| Illness | 116,069 | 123,164 | 239,233 | 48.5% | 51.5% |
| Work accident | 554 | 3,715 | 4,269 | 13.0% | 87.0% |
| Maternity / Paternity | 104,782 | 12,300 | 117,082 | 89.5% | 10.5% |
| Paid leave | 37,850 | 66,655 | 104,505 | 36.2% | 63.8% |
| Unpaid leave | 2,164 | 1,830 | 3,994 | 54.2% | 45.8% |
| Total | 261,420 | 207,664 | 469,083 | 55.7% | 44.3% |
Training hours
| BREAKDOWN IN TRAINING HOURS BY PROFESSIONAL CATEGORY AND GENDER | ||||
| 2023 | ||||
| Women | Men | Non-binary and undeclared | Total | |
| Executives | 426 | 1,323 | 0 | 1,749 |
| Directors | 5,315 | 8,876 | 10 | 14,201 |
| Senior management | 9,945 | 12,615 | 0 | 22,560 |
| Management | 29,269 | 35,574 | 0 | 64,843 |
| Senior Professionals | 55,040 | 56,902 | 131 | 112,073 |
| Professionals | 200,798 | 149,146 | 825 | 350,769 |
| Administrative staff / Manufacturing operators | 3,529,520 | 1,469,506 | 17,356 | 5,016,381 |
| Total | 3,830,313 | 1,733,941 | 18,322 | 5,582,576 |
| % by gender | 69% | 31% | 0% | 100% |
| Average workforce* | 11,021 | 8,255 | 38 | 19,315 |
| Ratio | 347,54 | 210,04 | 479,61 | 289,03 |
*Average workforce used for the calculation of training ratios. It corresponds to 96.5% of the total average workforce.
| BREAKDOWN IN TRAINING HOURS BY PROFESSIONAL CATEGORY AND GENDER | ||||
| 2022 | ||||
| Women | Men | Non-binary and undeclared | Total | |
| Executives | 512 | 1,349 | 0 | 1,861 |
| Directors | 6,432 | 8,889 | 46 | 15,367 |
| Senior management | 8,280 | 11,647 | 0 | 19,927 |
| Management | 20,143 | 26,018 | 12 | 46,173 |
| Senior Professionals | 46,076 | 56,366 | 17 | 102,459 |
| Professionals | 102,709 | 92,304 | 434 | 195,447 |
| Administrative staff / Manufacturing operators | 3,127,749 | 1,196,391 | 13,440 | 4,337,580 |
| Total | 3,311,901 | 1,392,964 | 13,949 | 4,718,814 |
| % by gender | 70% | 30% | 0% | 100% |
| Average workforce | 13,362 | 9,062 | 26 | 22,450 |
| Ratio | 247.86 | 153.71 | 536.50 | 210.19 |
| BREAKDOWN IN TRAINING HOURS BY PROFESSIONAL CATEGORY AND GENDER | ||||
| 2021 | ||||
| Women | Men | Non-binary and undeclared | Total | |
| Executives | 707 | 1,482 | 0 | 2,189 |
| Directors | 4,060 | 7,024 | 0 | 11,084 |
| Senior management | 10,567 | 12,688 | 0 | 23,255 |
| Management | 20,183 | 23,960 | 0 | 44,143 |
| Senior Professionals | 38,309 | 45,206 | 0 | 83,515 |
| Professionals | 122,234 | 105,079 | 0 | 227,313 |
| Administrative staff / Manufacturing operators | 1,699,131 | 728,586 | 231 | 2,427,948 |
| Total | 1,895,191 | 924,025 | 231 | 2,819,447 |
| % by gender | 67% | 33% | 0% | 100% |
| Average workforce | 11,998 | 8,624 | 1 | 20,623 |
| Ratio | 157.96 | 107.15 | 231.00 | 136.71 |
| BREAKDOWN IN TRAINING HOURS BY PROFESSIONAL CATEGORY AND GENDER - biotest | ||||||
| 2023 | 2022 | |||||
| Women | Men | Total | Women | Men | Total | |
| Executives | 33 | 37 | 70 | 218 | 545 | 763 |
| Directors | 197 | 424 | 621 | 2,058 | 2,352 | 4,409 |
| Senior management | 329 | 1,028 | 1,357 | 3,673 | 3,000 | 6,673 |
| Management | 1,325 | 1,016 | 2,341 | 2,298 | 1,860 | 4,158 |
| Senior Professionals | 5,745 | 6,841 | 12,586 | 3,897 | 2,714 | 6,611 |
| Professionals | 8,526 | 3,753 | 12,279 | 6,919 | 1,392 | 8,311 |
| Administrative staff / Manufacturing operators | 10,881 | 18,700 | 29,580 | 10,025 | 10,749 | 20,775 |
| Total | 27,036 | 31,798 | 58,835 | 29,088 | 22,612 | 51,700 |
| % by gender | 46% | 54% | 100% | 56% | 44% | 100% |
| Average workforce | 1,322 | 1,166 | 2,487 | - | - | - |
| Ratio | 20.45 | 27.28 | 23.65 | - | - | - |
| BREAKDOWN IN TRAINING HOURS BY COUNTRY AND GENDER | ||||||
| 2023 | ||||||
| Women | Men | Non-binary and undeclared | Total | Training days per employee | % of employees that received training | |
| U.S. | 3,481,344 | 1,462,761 | 18,322 | 4,962,428 | 44,56 | 94.4% |
| Spain | 132,220 | 171,070 | 0 | 303,291 | 377,813.12 | 96.5% |
| ROW | 216,748 | 100,109 | 0 | 316,857 | 5,419,698.50 | 91.8% |
| Total | 3,830,312 | 1,733,940 | 18,322 | 5,582,576 | 5,797,556.20 | n/a |
| BREAKDOWN IN TRAINING HOURS BY COUNTRY AND GENDER | ||||
| 2022 | ||||
| Women | Men | Non-binary and undeclared | Total | |
| U.S. | 3,105,514 | 1,190,597 | 13,949 | 4,310,060 |
| Spain | 115,414 | 153,995 | 0 | 269,409 |
| ROW | 90,972 | 48,373 | 0 | 139,345 |
| Total | 3,311,900 | 1,392,965 | 13,949 | 4,718,814 |
| BREAKDOWN IN TRAINING HOURS BY COUNTRY AND GENDER | ||||
| 2021 | ||||
| Women | Men | Non-binary and undeclared | Total | |
| U.S. | 1,681,538 | 730,020 | 231 | 2,411,789 |
| Spain | 99,756 | 133,292 | 0 | 233,048 |
| ROW | 113,897 | 60,713 | 0 | 174,610 |
| Total | 1,895,191 | 924,025 | 231 | 2,819,447 |
| BREAKDOWN IN TRAINING HOURS BY COUNTRY AND GENDER - biotest | ||||||
| 2023 | 2022 | |||||
| Women | Men | Total | Women | Men | Total | |
| Germany | 20,626 | 29,701 | 50,327 | 16,649 | 18,948 | 35,597 |
| Spain | 0 | 0 | 0 | 377 | 80 | 457 |
| U.S. | 0 | 0 | 0 | 0 | 0 | 0 |
| ROW | 6,410 | 2,097 | 8,507 | 12,062 | 3,584 | 15,645 |
| Total | 27,036 | 31,798 | 58,835 | 29,088 | 22,612 | 51,700 |
| BREAKDOWN IN TRAINING HOURS IN HEALTH AND SAFETY AND ENVIRONMENT | |||
| 2023 | 2022 | 2021 | |
| Total | 96,759 | 170,240 | 141,418 |
| BREAKDOWN IN TRAINING HOURS IN HEALTH AND SAFETY AND ENVIRONMENT - biotest | ||
| 2023 | 2022 | |
| Total | 5,758 | 5,230 |
Performance Reviews
| PERCENTAGE OF EMPLOYEES RECEIVING REGULAR PERFORMANCE AND CAREER DEVELOPMENT REVIEWS | ||
| 2023 | 2022 | |
| Executives | 88.9% | 41.9% |
| Directors | 99.4% | 81.8% |
| Senior management | 99.2% | 86.5% |
| Management | 99.6% | 89.1% |
| Senior Professionals | 99.5% | 88.5% |
| Professionals | 99.4% | 88.2% |
| Administrative staff / Manufacturing operators | 99.3% | 83.6% |
| Total | 99.2% | 86.0% |
| PERCENTAGE OF EMPLOYEES RECEIVING REGULAR PERFORMANCE AND CAREER DEVELOPMENT REVIEWS - biotest | |
| 2023 | |
| Executives | 100% |
| Directors | 94% |
| Senior management | 100% |
| Management | 94% |
| Senior Professionals | 92% |
| Professionals | 85% |
| Administrative staff / Manufacturing operators | 94% |
| Total | 91% |
| PERCENTAGE OF EMPLOYEES RECEIVING REGULAR PERFORMANCE AND CAREER DEVELOPMENT REVIEWS BY GENDER | ||
| 2023 | 2022 | |
| Women | 99.4% | 85.2% |
| Men | 99.4% | 87.1% |
| Non-binary and undeclared | 0.0% | 50.0% |
| Total | 99.2% | 86.0% |
| PERCENTAGE OF EMPLOYEES RECEIVING REGULAR PERFORMANCE AND CAREER DEVELOPMENT REVIEWS BY GENDER - biotest | |
| 2023 | |
| Women | 86.1% |
| Men | 97.5% |
| Total | 91.4% |
Parental leave
| PARENTAL LEAVE AND RETURN TO WORK | ||||||
| 2023 | 2022 | |||||
| Women | Men | Total | Women | Men | Total | |
| Nº employees that were entitled to parental leave | 100% | 100% | 100% | 100% | 100% | 100% |
| Nº employees that took parental leave | 284 | 234 | 518 | 405 | 238 | 643 |
| Nº employees that returned to work in the reporting period after parental leave ended | 226 | 167 | 393 | 465 | 245 | 710 |
| Return to work rate | 74% | 89% | 79% | 83% | 94% | 87% |
| Total number of employees that returned to work after parental leave ended that were still employed 12 months after their return to work | 237 | 184 | 421 | 246 | 160 | 406 |
| Retention rate | 61% | 80% | 68% | 56% | 80% | 64% |
| PARENTAL LEAVE AND RETURN TO WORK - BIOTEST | |||
| 2023 | |||
| Women | Men | Total | |
| Nº employees that were entitled to parental leave | 100% | 100% | 100% |
| Nº employees that took parental leave | 171 | 47 | 218 |
| Nº employees that returned to work in the reporting period after parental leave ended | 65 | 39 | 104 |
| Return to work rate | 97% | 100% | 98% |
| Total number of employees that returned to work after parental leave ended that were still employed 12 months after their return to work | 49 | 40 | 89 |
| Retention rate | 29% | 85% | 41% |
Accidental rate
| ACCIDENT RATE | ||||||||
| U.S. 2023 | U.S. 2022 | Spain 2023 | Spain 2022 | |||||
| Women | Men | Women | Men | Women | Men | Women | Men | |
| Total number of work accidents with leave* (LTI) without leave (NLTI) and first aid (FA) | 793 | 364 | 928 | 373 | 108 | 116 | 90 | 122 |
| Total number of work accidents with leave** (LTI) | 48 | 30 | 76 | 19 | 29 | 40 | 26 | 42 |
| Hours worked | 23,713,456 | 13,201,648 | 19,160,137 | 11,166,314 | 3,008,221 | 3,752,636 | 2,939,603 | 3,724,420 |
| Accident Frequency Index*** | 2.0 | 2.3 | 4 | 1.7 | 9.6 | 10.7 | 8.8 | 11.3 |
| Severity Index**** | 0.04 | 0.05 | 0.11 | 0.09 | 0.25 | 0.33 | 0.29 | 0.31 |
| Professional illnesses | 0 | 0 | 0 | 0 | 0 | 0 | 0 | 0 |
| Fatalities resulting from occupational injuries and illnesses | 0 | 0 | 0 | 0 | 0 | 0 | 0 | 0 |
| Work accidents of contractors | 2 | 3 | n/d | n/d | 10 | 6 | n/d | n/d |
*Total number of accidents with sick leave (non itinere) without sick leave and first aid,
**Total number of accidents with sick leave (non itinere) excluding COVID
***Number of occupational accidents with sick leave (non itinere) excluding COVID / total no. of actual hours worked *10^6
****Nº of days not worked due to occupational accidents with sick leave (non itinere) excluding COVID /nº of actual hours worked *10^3),
The days lost are counted as the difference between the calendar days (without discounting holidays or vacations in the calculation) between the date of discharge and the date of sick leave,
| ACCIDENT RATE | ||||||||
| Ireland 2023 | Ireland 2022 | Germany 2023 | Germany 2022 | |||||
| Women | Men | Women | Men | Women | Men | Women | Men | |
| Total number of work accidents with leave* (LTI) without leave (NLTI) and first aid (FA) | 11 | 9 | 7 | 3 | 41 | 17 | 63 | 13 |
| Total number of work accidents with leave** (LTI) | 2 | 2 | 0 | 1 | 5 | 3 | 20 | 4 |
| Hours worked | 331,650 | 422,262 | 259,428 | 339,417 | 1,584,078 | 700,757 | 1,383,458 | 664,814 |
| Accident Frequency Index*** | 6.0 | 4.7 | 0.0 | 2.9 | 3.2 | 4.3 | 14.5 | 6.0 |
| Severity Index**** | 0.02 | 0.07 | 0.00 | 0.00 | 0.02 | 0.05 | 0.14 | 0.10 |
| Professional illnesses | 0 | 0 | 0 | 0 | 0 | 0 | 0 | 0 |
| Fatalities resulting from occupational injuries and illnesses | 0 | 0 | 0 | 0 | 0 | 0 | 0 | 0 |
| Work accidents of contractors | 0 | 2 | n/d | n/d | 0 | 0 | n/d | n/d |
*Total number of accidents with sick leave (non itinere) without sick leave and first aid,
**Total number of accidents with sick leave (non itinere) excluding COVID
***Number of occupational accidents with sick leave (non itinere) excluding COVID / total no. of actual hours worked *10^6
****Nº of days not worked due to occupational accidents with sick leave (non itinere) excluding COVID /nº of actual hours worked *10^3),
The days lost are counted as the difference between the calendar days (without discounting holidays or vacations in the calculation) between the date of discharge and the date of sick leave,
| ACCIDENT RATE - biotest | ||||
| Germany 2023 | Germany 2022 | |||
| Women | Men | Women | Men | |
| Total number of work accidents with leave* (LTI) without leave (NLTI) and first aid (FA) | 17 | 21 | 61 | 26 |
| Total number of work accidents with leave** (LTI) | 14 | 18 | 9 | 23 |
| Hours worked | 1,608,089 | 2,029,541 | 1,451,784 | 1,792,284 |
| Accident Frequency Index*** | 8.7 | 8.9 | 6.2 | 12.8 |
| Severity Index**** | 0.23 | 0.18 | 0.26 | 0.05 |
| Lost days | 128.00 | 134.00 | - | - |
*Total number of accidents with sick leave (non itinere) without sick leave and first aid
**Total number of accidents with sick leave (non itinere) excluding COVID
***Number of occupational accidents with sick leave (non itinere) excluding COVID / total no. of actual hours worked *10^6
****Nº of days not worked due to occupational accidents with sick leave (non itinere) excluding COVID /nº of actual hours worked *10^3),
The days lost are counted as the difference between the calendar days (without discounting holidays or vacations in the calculation) between the date of discharge and the date of sick leave,
Average wage*
| AVERAGE WAGE BY PROFESSIONAL CATEGORY AND GENDER IN SPAIN IN EUROS | ||||
| Professional category | Fixed Wage- Average 2023 | Fixed Wage- Average 2022 | Fixed Wage- Average 2021 | |
| Executives | Women | 234,199.4 | 287,311.2 | 212,963.7 |
| Men | 294,979.5 | 283,288.9 | 270,613.6 | |
| Directors | Women | 111,424.2 | 106,426.4 | 99,625.6 |
| Men | 126,485.0 | 122,761.5 | 120,321.9 | |
| Senior management | Women | 80,243.2 | 77,615.6 | 77,568.5 |
| Men | 85,223.4 | 82,403.3 | 81,002.8 | |
| Management | Women | 57,197.7 | 56,150.6 | 55,164.9 |
| Men | 61,608.1 | 59,679.4 | 59,317.4 | |
| Senior professionals | Women | 44,306.0 | 42,881.6 | 41,756.0 |
| Men | 47,444.7 | 46,370.8 | 45,345.3 | |
| Professionals | Women | 38,582.9 | 37,776.2 | 36,836.7 |
| Men | 40,571.3 | 39,319.5 | 38,559.2 | |
| Administrative staff / Manufacturing operators | Women | 28,917.7 | 28,202.0 | 27,597.7 |
| Men | 29,434.8 | 28,774.1 | 28,136.4 | |
| AVERAGE WAGE BY PROFESSIONAL CATEGORY AND GENDER IN U.S. IN USD | ||||
| PLASMA CENTERS | ||||
| Professional category | Fixed Wage- Average 2023 | Fixed Wage- Average 2022 | Fixed Wage- Average 2021 | |
| Executives | Women | n/a | 423,128.9 | 377,434.2 |
| Men | n/a | 327,646.3 | 401,357.4 | |
| Directors | Women | 228,290.9 | 200,068.6 | 200,302.6 |
| Men | 255,886.1 | 227,863.1 | 214,532.9 | |
| Senior management | Women | 159,492.0 | 158,824.1 | 144,350.6 |
| Men | 166,865.6 | 162,299.8 | 158,173.6 | |
| Management | Women | 112,733.3 | 105,920.4 | 98,616.3 |
| Men | 118,827.3 | 111,852.3 | 108,925.6 | |
| Senior professionals | Women | 94,243.2 | 90,679.2 | 85,525.7 |
| Men | 96,902.6 | 93,429.4 | 91,855.2 | |
| Professionals | Women | 72,915.4 | 67,403.6 | 62,362.5 |
| Men | 75,593.9 | 70,289.3 | 65,102.4 | |
| Administrative staff / Manufacturing operators | Women | 43,135.0 | 42,367.8 | 37,798.8 |
| Men | 42,339.7 | 41,653.4 | 37,421.6 | |
| AVERAGE WAGE BY PROFESSIONAL CATEGORY AND GENDER IN U.S. IN USD | ||||
| REST OF ACTIVITIES | ||||
| Professional category | Fixed Wage- Average 2023 | Fixed Wage- Average 2022 | Fixed Wage- Average 2021 | |
| Executives | Women | 352,372.9 | 431,673.0 | 303,731.8 |
| Men | 438,137.8 | 402,767.9 | 406,172.7 | |
| Directors | Women | 233,132.0 | 222,949.8 | 205,835.1 |
| Men | 240,232.8 | 230,487.9 | 217,810.3 | |
| Senior management | Women | 179,262.4 | 170,195.2 | 165,250.4 |
| Men | 185,042.4 | 177,603.8 | 166,667.3 | |
| Management | Women | 139,678.2 | 133,476.6 | 124,956.6 |
| Men | 143,599.6 | 139,899.7 | 131,632.8 | |
| Senior professionals | Women | 116,940.4 | 112,693.1 | 104,338.8 |
| Men | 116,913.4 | 112,378.6 | 105,809.3 | |
| Professionals | Women | 82,492.1 | 80,065.1 | 73,199.3 |
| Men | 85,750.6 | 83,287.4 | 77,673.7 | |
| Administrative staff / Manufacturing operators | Women | 61,515.8 | 60,957.0 | 57,175.9 |
| Men | 65,179.4 | 63,889.0 | 61,328.9 | |
| AVERAGE WAGE BY PROFESSIONAL CATEGORY AND GENDER IN Ireland IN EUROS | ||||
| Professional category | Fixed Wage- Average 2023 | Fixed Wage- Average 2022 | Fixed Wage- Average 2021 | |
| Executives | Women | n/a | n/a | n/a |
| Men | n/a | n/a | n/a | |
| Directors | Women | n/a | n/a | n/a |
| Men | n/a | n/a | n/a | |
| Senior management | Women | 128,321.6 | 110,980.0 | 115,833.3 |
| Men | 120,028.7 | 119,091.7 | 108,211.1 | |
| Management | Women | 83,334.8 | 70,401.7 | 69,802.4 |
| Men | 88,575.4 | 80,401.0 | 73,069.3 | |
| Senior profesionals | Women | 62,005.0 | 55,616.3 | 52,880.6 |
| Men | 66,819.6 | 59,794.8 | 54,338.6 | |
| Professionals | Women | 48,759.5 | 45,099.1 | 43,448.2 |
| Men | 51,747.3 | 48,099.6 | 45,496.2 | |
| Administrative staff / Manufacturing operators | Women | 39,247.8 | 37,382.6 | 37,401.8 |
| Men | 38,461.4 | 36,875.3 | 37,545.3 | |
| AVERAGE WAGE BY PROFESSIONAL CATEGORY AND GENDER IN GERMANY IN EUROS | ||||
| Professional category | Fixed Wage- Average 2023 | Fixed Wage- Average 2022 | Fixed Wage- Average 2021 | |
| Executives | Women | n/a | n/a | n/a |
| Men | n/a | n/a | n/a | |
| Directors | Women | 180,605.6 | 172,301.1 | 175,768.2 |
| Men | 188,398.1 | 183,879.9 | 162,279.9 | |
| Senior management | Women | 101,051.5 | 91,136.0 | 97,142.7 |
| Men | 109,449.3 | 116,751.0 | 116,580.1 | |
| Management | Women | 86,663.5 | 83,347.3 | 76,584.4 |
| Men | 91,333.4 | 88,562.4 | 84,118.2 | |
| Senior profesionals | Women | 60,886.8 | 58,765.4 | 57,413.9 |
| Men | 64,367.0 | 60,060.9 | 64,481.7 | |
| Professionals | Women | 60,190.7 | 62,654.9 | 60,365.9 |
| Men | 60,853.1 | 60,651.4 | 57,897.2 | |
| Administrative staff / Manufacturing operators | Women | 35,622.2 | 34,632.7 | 28,882.8 |
| Men | 34,675.7 | 33,317.0 | 28,014.3 | |
| AVERAGE WAGE BY PROFESSIONAL CATEGORY AND GENDER IN GERMANY IN EUROS - biotest | ||
| Professional category | Fixed Wage- Average 2023 men | Fixed Wage- Average 2023 women |
| Executives | n/a | n/a |
| Directors | 153,446.00 | 151,593.60 |
| Senior management | 116,617.38 | 112,625.57 |
| Management | 101,543.98 | 100,860.70 |
| Senior profesionals | 78,848.36 | 76,169.38 |
| Professionals | 64,096.59 | 58,187.40 |
| Administrative staff / Manufacturing operators | 46,270.39 | 42,781.62 |
| AVERAGE WAGE BY AGE IN SPAIN IN EUROS | |||
| Age | Fixed Wage- Average 2023 | Fixed Wage- Average 2022 | Fixed Wage- Average 2021 |
| <30 | 33,679.0 | 33,146.4 | 31,989.2 |
| 30-50 | 43,530.5 | 41,938.6 | 40,765.5 |
| >50 | 57,386.6 | 58,172.8 | 59,117.1 |
| AVERAGE WAGE BY AGE IN U.S. IN EUROS USD | |||
| Age | Fixed Wage- Average 2023 | Fixed Wage- Average 2022 | Fixed Wage- Average 2021 |
| <30 | 42,793.0 | 40,800.6 | 36,112.0 |
| 30-50 | 67,408.5 | 62,434.9 | 57,846.3 |
| >50 | 95,291.8 | 89,849.2 | 86,462.3 |
| AGE IN IRELAND IN EUROS | |||
| Age | Fixed Wage- Average 2023 | Fixed Wage- Average 2022 | Fixed Wage- Average 2021 |
| <30 | 50,611.4 | 48,304.7 | 46,946.5 |
| 30-50 | 65,679.4 | 57,997.7 | 55,937.7 |
| >50 | 63,748.0 | 82,253.7 | 89,154.0 |
| AVERAGE WAGE BY AGE IN GERMANY IN EUROS | |||
| Age | Fixed Wage- Average 2023 | Fixed Wage- Average 2022 | Fixed Wage- Average 2021 |
| <30 | 38,261.8 | 36,957.2 | 30,948.0 |
| 30-50 | 46,699.2 | 44,162.1 | 39,398.9 |
| >50 | 56,358.5 | 53,524.1 | 50,220.4 |
| AVERAGE WAGE BY AGE IN GERMANY IN EUROS - biotest | |
| Age | Fixed Wage- Average 2023 |
| <30 | 44,784.1 |
| 30-50 | 64,397.3 |
| >50 | 72,330.1 |
*To avoid distorting the results, the average fixed salary excludes salaries based on seniority or individual/personal events
| AVERAGE RETRIBUTION OF BOARD MEMBERS AND EXECUTIVES BY GENDER | |||||||||
| 2023 | 2022 | 2021 | |||||||
| Euros | Women | Men | Total | Women | Men | Total | Women | Men | Total |
| Total average salary | 245,745.4 | 301,275.3 | 281,113.3 | 250,329.3 | 292,935.3 | 277,054.2 | 223,249.3 | 278,680.7 | 259,405.0 |
| Executives, employees and Board Members | 179 | 314 | 493 | 186 | 313 | 499 | 177 | 332 | 509 |
| Salary gap | 18.43% | 14.50% | 19.90% | ||||||
* To avoid distorting the results, the average fixed salary excludes salaries based on seniority or individual/personal events. It is the average of the Annual Gross Fixed Salary at 100% occupancy
Gender pay gap
| GENDER PAY GAP / SPAIN | ||||||
| Adjusted Gender Pay Gap 2023 | Gender Pay Gap 2023 | Adjusted Gender Pay Gap 2022 | Gender Pay Gap 2022 | Adjusted Gender Pay Gap 2021 | Gender Pay Gap 2021 | |
| Executives | n/a | 20.60% | n/a | -1.40% | n/a | 21.30% |
| Directors | 9.97% | 11.91% | 6.50% | 13.30% | 17.20% | 17.20% |
| Senior management | 5.84% | 5.84% | 5.30% | 5.80% | 3.50% | 4.20% |
| Management | 5.47% | 7.16% | 4.40% | 5.90% | 6.30% | 7.00% |
| Senior professionals | 3.23% | 6.62% | 4.00% | 7.50% | 3.10% | 7.90% |
| Professionals | 2.15% | 4.90% | 3.00% | 3.90% | 2.30% | 4.50% |
| Administrative staff /Manufacturing operators | 0.79% | 1.76% | 0.90% | 2.00% | 0.80% | 1.90% |
| GENDER PAY GAP / U.S. - Plasma centers | ||||||
| Adjusted Gender Pay Gap 2023 | Gender Pay Gap 2023 | Adjusted Gender Pay Gap 2022 | Gender Pay Gap 2022 | Adjusted Gender Pay Gap 2021 | Gender Pay Gap 2021 | |
| Executives | n/a | n/a | n/a | -29.10% | n/a | 6.00% |
| Directors | n/a | 10.78% | 2.80% | 12.20% | -1.20% | 6.60% |
| Senior management | n/a | 4.42% | n/a | 2.10% | n/a | 8.70% |
| Management | 3.46% | 5.13% | 1.80% | 5.30% | 6.30% | 9.50% |
| Senior professionals | 0.82% | 2.74% | -0.60% | 2.90% | 5.40% | 6.90% |
| Professionals | 2.40% | 3.54% | 3.70% | 4.10% | 4.40% | 4.20% |
| Administrative staff /Manufacturing operators | -1.87% | -1.88% | -2.50% | -1.70% | -1.50% | -1.00% |
| GENDER PAY GAP / U.S. - Rest of activities | ||||||
| Adjusted Gender Pay Gap 2023 | Gender Pay Gap 2023 | Adjusted Gender Pay Gap 2022 | Gender Pay Gap 2022 | Adjusted Gender Pay Gap 2021 | Gender Pay Gap 2021 | |
| Executives | n/a | 19.57% | n/a | -7.20% | n/a | 25.20% |
| Directors | 1.25% | 2.96% | 1.30% | 3.30% | 5.20% | 5.50% |
| Senior management | 1.20% | 3.12% | 2.50% | 4.20% | -1.00% | 0.90% |
| Management | 5.46% | 2.73% | 6.70% | 4.60% | 4.50% | 5.10% |
| Senior professionals | 2.75% | -0.02% | 1.30% | -0.30% | 3.20% | 1.40% |
| Professionals | 1.72% | 3.80% | 2.30% | 3.90% | 1.80% | 5.80% |
| Administrative staff /Manufacturing operators | 4.82% | 5.62% | 4.50% | 4.60% | 5.20% | 6.80% |
| GENDER PAY GAP / IRELAND | ||||||
| Adjusted Gender Pay Gap 2023 | Gender Pay Gap 2023 | Adjusted Gender Pay Gap 2022 | Gender Pay Gap 2022 | Adjusted Gender Pay Gap 2021 | Gender Pay Gap 2021 | |
| Executives | n/a | n/a | n/a | n/a | n/a | n/a |
| Directors | n/a | n/a | n/a | n/a | n/a | n/a |
| Senior management | n/a | -6.91% | n/a | 6.80% | n/a | -7.00% |
| Management | n/a | 5.92% | n/a | 12.40% | n/a | 4.50% |
| Senior professionals | 7.08% | 7.21% | 4.90% | 7.00% | -1.00% | 2.70% |
| Professionals | 1.63% | 5.77% | n/a | 6.20% | 1.80% | 4.50% |
| Administrative staff /Manufacturing operators | 0.37% | -2.04% | -1.00% | -1.40% | -1.00% | 0.40% |
| GENDER PAY GAP / GERMANY | ||||||
| Adjusted Gender Pay Gap 2023 | Gender Pay Gap 2023 | Adjusted Gender Pay Gap 2022 | Gender Pay Gap 2022 | Adjusted Gender Pay Gap 2021 | Gender Pay Gap 2021 | |
| Executives | n/a | n/a | n/a | n/a | n/a | n/a |
| Directors | n/a | 4.14% | n/a | 6.30% | n/a | -8.30% |
| Senior management | n/a | 7.67% | n/a | 21.90% | n/a | 16.70% |
| Management | n/a | 5.11% | n/a | 5.90% | n/a | 9.00% |
| Senior professionals | 2.37% | 5.41% | n/a | 2.20% | 8.90% | 11.00% |
| Professionals | 4.09% | 1.09% | 2.10% | -3.30% | -0.70% | -4.30% |
| Administrative staff /Manufacturing operators | 0.13% | -2.73% | -1.40% | -3.90% | -4.20% | -3.10% |
For confidentiality and personal data protection reasons, no pay gap data is shown in those professional categories in which there is not a minimum of 4 people of each gender. The adjusted gender pay gap is not shown in those categories for which it is not possible to obtain data with enough statistical significance through the econometric model.
| GENDER PAY GAP / GERMANY - biotest | ||
| Adjusted Gender Pay Gap 2023 | Gender Pay Gap 2023 | |
| Executives | n/a | n/a |
| Directors | n/a | 1.21% |
| Senior management | n/a | 3.42% |
| Management | -0.83% | 0.67% |
| Senior professionals | 3.14% | 3.40% |
| Professionals | 1.93% | 9.22% |
| Administratives/Manufacturing Operators | -6.67% | 7.54% |
| Total | -0.91% | 1.49% |