Grifols aspires to minimize the environmental impact of its operations through efficient resource management and a solid commitment to sustainable development. The company’s environmental commitment is based on three key cornerstones: the climate, promoting the circular economy and protecting biodiversity.
Our roadmap
- Reduce greenhouse gas emissions per unit of production*
- Increase energy efficiency per unit of production
- Consume all electrical energy from renewable sources
- Accelerate decarbonization by reducing business trips and employee travel
- Implement more circular economy measures throughout the business life cycle
- Protect biodiversity through the Grifols Wildlife Program
2050: net zero emissions*
*Scopes 1 and 2.
AWARDS AND RECOGNITIONS


Three key priorities
-
CLIMATE ACTION
Accelerate decarbonization in our operations -
CIRCULAR ECONOMY
Minimize our environmental impact -
BIODIVERSITY
Promote biodiversity and conservation on natural areas
Environmental management at Grifols
A cross-cutting and comprehensive approach
Gestión de los grupos de interés de Grifols
 |
Eco-efficiency |
|
 |
Prevention |
|
 |
Legislative compliance |
|
 |
Proactivity: short- and long-term action plans |
|
 |
Environmental communication and awareness |
|
More information and details at Science Based Targets Initiative (SBTi)
We strive to find alternatives to reduce the impact of our products throughout their life cycle
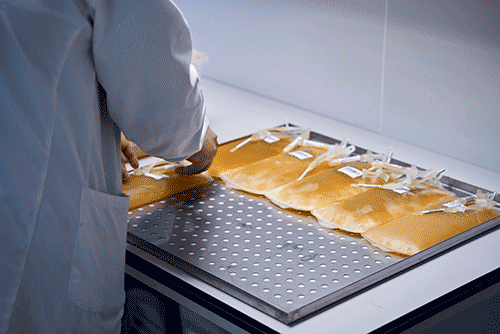
Product quality and safety are a top priority at Grifols, including their presentation in the most environmentally-sustainably packaging. To this end, the company performed a study in the European market comparing glass packaging to plastic bags for 100 mL format albumin, taking into account all phases of the life cycle analysis (LCA).
The study was conducted in collaboration with Grup Carles and the UNESCO Chair of Life Cycle and Climate Change ESCI-UPF in line with the ISO 14044 standard and using Gabi LCA software. After normalizing the results, the nine most relevant impact categories were analyzed in depth, as well as the water scarcity indicator.
While widely considered more harmful to ecosystems, plastic bags were found to have a lower environmental impact than glass vials, scoring higher in all impact categories analyzed. The change in the product’s packaging reduces its carbon footprint, leading to a 55% reduction in water consumption and a 23% improvement in climate change overall.
By way of example, supplying 10,000 units of albumin (20%) in 100 mL doses in plastic bags instead of glass vials avoids 655 kg of CO2e emission and 355 m3 of water consumption. This is equivalent to driving 3,930 km in a mid-range car and taking 3,500 five-minute showers.
A continually evolving internal regulatory system
Grifols endeavors to implement best practices to fulfill its commitments and address the needs of a changing environmental landscape, including the ongoing review of environmental and energy regulations.
Policies
Sustainability policy: Establishes the organization’s core environmental and social responsibility principles and commitments, and serves as a framework for their full integration into the business model.
Environmental policy: Defines Grifols’ guidelines, principles and commitments in order to monitor and minimize its environmental impact.
Climate action policy: Approved in 2023, this establishes Grifols’ concrete climate-action commitments.
Energy policy: Updated in 2023, this policy outlines the core objectives in Grifols’ Environmental Management System, including eight key commitments to minimize energy demand and promote the use of renewable energies.
Biodiversity policy: Approved in 2024, it defines the necessary commitments to respect and promote biodiversity, offering a comprehensive view of Grifols’ efforts to protect biodiversity in all areas of operation and at every stage of the value chain.
Environmental certifications
Grifols has an ISO 14001-certified Environment Management System for its main production companies to identify and comply with all applicable environmental legislation; recognize the environmental impacts of its processes and products; implement preventive and corrective measures; and establish objectives to boost its environmental performance.
This comprehensive system includes the Corporate Environment Manual, which offers an organization-wide framework for Grifols’ environmental management.
All certified companies and those in the process of certification have an environmental committee led by their respective senior management team. This committee is the most important decision-making body in terms of defining environmental guidelines and assuring the correct execution and maintenance of the Environment Management System, including the allocation of requisite human and economic resources.
By the end of 2023, 73% of Grifols’ total production was manufactured in ISO 14001-certified plants, and 70% of manufacturing employees worked in certified plants.
Grifols prioritizes the certification process of its manufacturing plants by starting with those with larger production output and progressively taking steps to certify those with smaller production volumes and/or a lesser environmental impact. All certified plants are audited by TÜV Rheinland, an independent certification body.
Grifols also ensures its buildings and facilities are designed with sustainability in mind.
In 2023, Grifols continued to work towards LEED (Leadership in Energy and Environmental Design) certification for its production facilities in Montreal, Canada. LEED is the world’s largest scale rating system for sustainable buildings.
In 2023, Grifols was awarded a A- rating by the Carbon Disclosure Project (CDP) Climate Change, regaining the score received in 2021. The world’s leading environmental reporting platform, the CDP annually assesses companies’ climate change corporate strategies and performance. Grifols participated in the CDP Water Report in 2023 in alignment with its commitment to transparency with its diverse stakeholders.
| Management | Sustainably designed and eco-efficient facilities | ||||
| ISO 14001 | ISO 50001 | Certification LEED* | GREEN GLOBES** | ZERO WASTE TO LANDFILL*** | |
| SPAIN |
|
|
|||
| U.S. |
|
|
|
|
|
| canadA |
|
||||
| BIOTEST |
|
||||
* Leadership in Energy Efficiency and Environmental Design
** Green Globes, certified by the Green Building Initiative
*** Zero Waste to Landfill awarded by Underwriters Laboratories (UL)
Environmental governance and climate change action
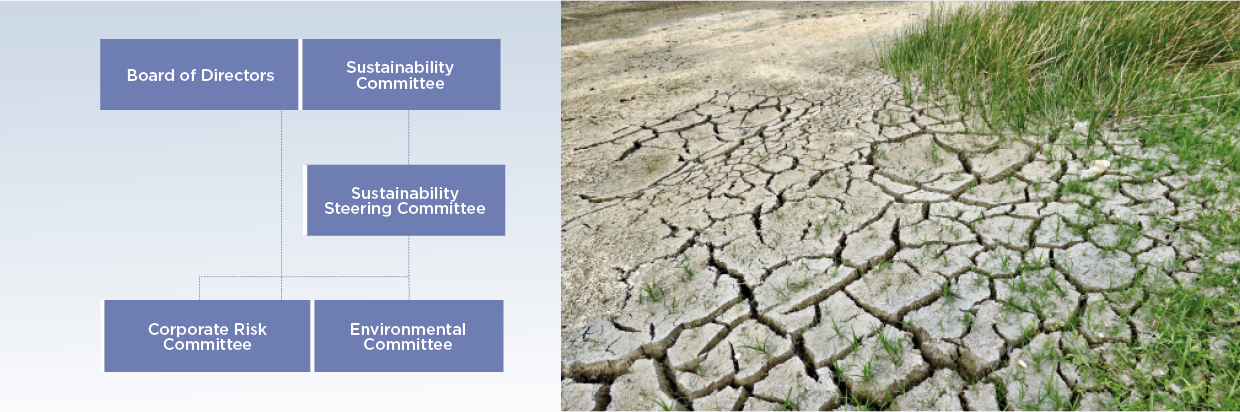
Grifols’ Board of Directors establishes a range of commitments to reduce environmental and climate risks, in addition to approving the corporate risk policy, sustainability policy and other policies related to the environment, climate action, energy and biodiversity. The Environmental Policy is signed by Grifols’ CEO.
The Executive Committee oversees Grifols’ environmental performance and disclosures, including climate-change indicators and actions, and analyses of related risks and financial impacts.
The Sustainability Committee, Sustainability Steering Committee and Environment Committee drive and direct the implementation of the environmental objectives, as well asthose associated with climate change and biodiversity defined in Grifols’ Sustainability Master Plan and environmental programs.
The Chief Industrial Services Officer (CISO) serves on the Executive Committee and Environment Committee, responsible for regularly reporting the status of Grifols’ environmental performance and climate-change issues to the CEO. The CISO also approves the energy policy, environmental program, and allocation of economic and human resources to meet environmental objectives.
Finally, the Corporate Risk Committee, which reports to the Board of Directors, is responsible for developing the risk management model and managing its most relevant risks, including those related to the environment and climate change.
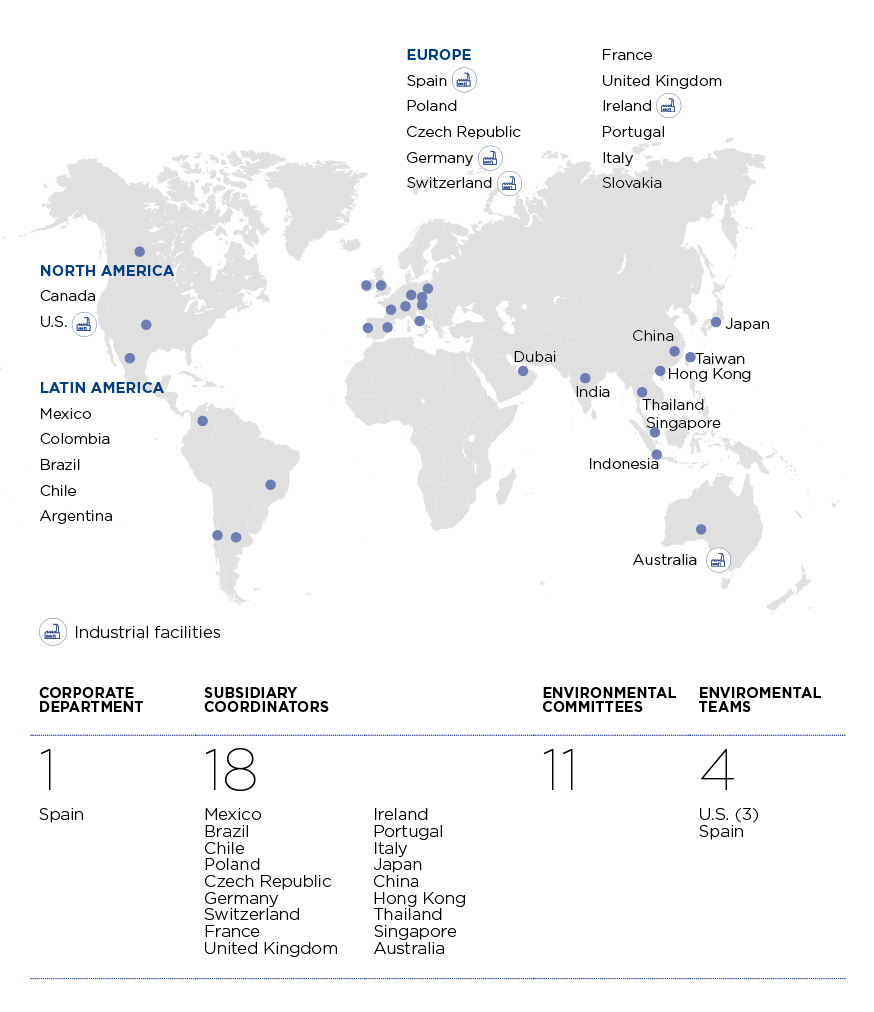
A global organization to manage environmental risks
As an organization with a vast global reach, Grifols spearheads broad-based efforts to control, prevent and manage environmental risks. All Grifols’ ISO 14001-certified facilities have robust management systems to minimize and mitigate environmental risks, including those derived from its operations (anthropogenic activity) and those produced by nature (natural), such as extreme weather and climate events.
Each facility has concrete self-protection plans that stipulate the necessary actions in the event of an environmental emergency and the teams responsible for their implementation.
Everyone involved in environmental risk management receives relevant training in accordance with Grifols’ continuous development strategy.
Provisions and guarantees for environmental risks
Grifols’ civil liability insurance covers accidental environmental pollution, defined as the disturbance of the natural state of the air, water, soil, flora or fauna (or any other situation legally deemed as environmental pollution) caused by emissions from its facilities as a result of accidental, sudden and unforeseen events. This insurance policy covers all Grifols’ companies, production facilities and offices in all its regions of operation.
In 2023, no relevant economic sanctions were issued in relation to adverse environmental impact.
Resources allocated to environmental management and climate change
Grifols allocated significant resources to bolster its environmental performance in 2023, helping the company make further inroads on its 2023-2026 Environmental Program objectives despite the global economic downturn of recent years.
Total environmental resource allocation in 2023 fell by 4% compared to 2022 in order to optimize and contain investments, leading to a 43% drop in investments channeled toward environmental assets. Expenditures increased by 9%.
Resource allocation
32.8M
*Includes costs and investments.
Investment in environmental assets
4.8M
- 54% eco-efficiency
- 11% water cycle
- 9% waste management
- 26% miscellaneous projects
Environmental expenses
28M
- 76% waste management
Allocated in the last 3 years
95M
2023-2026 Corporate Environmental Program
Grifols’ 2023-2026 Corporate Environmental Program addresses three fundamental areas: climate change, circular economy and biodiversity, establishing specific objectives and initiatives for each.
| 2023-2026 Corporate Environmental Program | DEGREE OF COMPLIANCE ACTIONS AT 2023 YEAR END | |
| Climate Change | ||
| Reduce carbon emissions by 60,000 tons per year through renewable energy production and eco-efficiency measures (Scope 1 and 2) | RENEWABLE ENERGY | 39.78% |
| Sign PPA (Power Purchasing Agreement) agreements for the purchase of 169,000 MWh of renewable electricity per year in Spain and the U.S.
Reduction of more than 56,960 metric tons of CO2e per year. |
||
| Execute on-site renewable energy generation projects with a total capacity of 500 kW.
Annual reduction of 132 metric tons of CO2e. |
||
| INCREASED ENERGY EFFICIENCY | ||
| Apply artificial intelligence measures in chilled water control systems.
Energy savings of 4,170 MWh/year. Reduction of more than 1,333 metric tons of CO2e annually. |
||
| Implement measures to reduce heating consumption for hot water generation in production.
Energy saving in heating 3,300 MWh/year. Reduction of more than 598 metric tons of CO2e per year. |
||
| Improve energy efficiency in industrial refrigeration systems by centralizing the glycol generation circuits at -20ºC and 0ºC.
Energy savings of more than 3,500 MWh/year. Reduction of more than 525 metric tons of CO2e per year. |
||
| Apply energy efficiency measures in cooling towers.
Electric energy savings of 990 MWh/year. Reduction of 149 metric tons of CO2e per year. |
||
| Apply energy optimization measures in Diagnostic facilities in Barcelona (Spain): buildings, water treatment circuits for injection and air treatment systems in production areas.
Energy savings of more than 600 MWh/year. Reduction of 95 metric tons of CO2e per year. |
||
| Recover the biomethane generated in the new treatment plant for use as fuel in steam boilers.
Energy savings of 450 MWh/year. Reduction of 80 metric tons of CO2e per year. |
||
| Apply energy optimization measures in -30ºC plasma storage facilities.
Electrical energy savings of more than 120 MWh/year. Reduction of 33 metric tons of CO2e per year. |
||
| Changes in the plastic bags forming machines for intravenous solutions to reduce electricity consumption.
Energy savings of 180 MWh/year. Reduction of 26 metric tons of CO2e emissions per year. |
||
| Implement energy saving measures by installing LED technology, window blinds and renovate cold storage technology.
Electricity savings of 74 MWh/year. Reduction of 25 metric tons of CO2e per year. |
||
| Implement cost-saving measures by installing LED lighting.
Reduction of 18 metric tons of CO2e per year. |
||
| Progressive replacement of electric motors with more efficient models.
Energy savings of 0.1 MWh/year. Reduction of 0.02 metric tons of CO2e per year. |
||
| Conduct energy efficiency audits. | ||
| Reduce CO2e emissions caused by refrigerant gas leaks by replacing them with others with a lower Alower Global Warming Potential (GWP) refrigerants. | ||
| Obtain LEED certification for new buildings.
Reduction of 149 metric tons of CO2e per year. |
||
| Minimize carbon emissions in business trips, employee travel and waste service transportation | Maintain or increase remote working options at all Grifols facilities where feasible. | |
| Maintain and when possible increase the use of video calls to reduce the need for air travel. | ||
| Reduce carbon emissions in tons/km in leasing car fleet by incorporating environmental measures in the contract. | ||
| Reduce carbon emissions from supply chain transportation through agreements with operators. | ||
| Reducing frequency of waste service transportation by optimizing storage.
Reduction of 1.2 t metric tons of CO2e per year. |
||
| Circular economy | ||
| Reduce water consumption by more than 85,000 m3 per year | Reduce water consumption for services.
Reduction of more than 46,000 m3 per year. |
41,64% |
| Reduce water rejection generated in water treatment for production purposes.
Reduction of more than 39,000 m3 per year. |
||
| Wastewater discharge reduction parameters | Reduce chemical oxygen demand (COD) discharged to wastewater by 240 mg/L by treating more effluents with high organic load in the biological treatment plant.
Reduction of 123 tons per year. |
|
| Maintain “zero waste to landfill” certification | Maintain “Zero Waste to Landfill” certification. | |
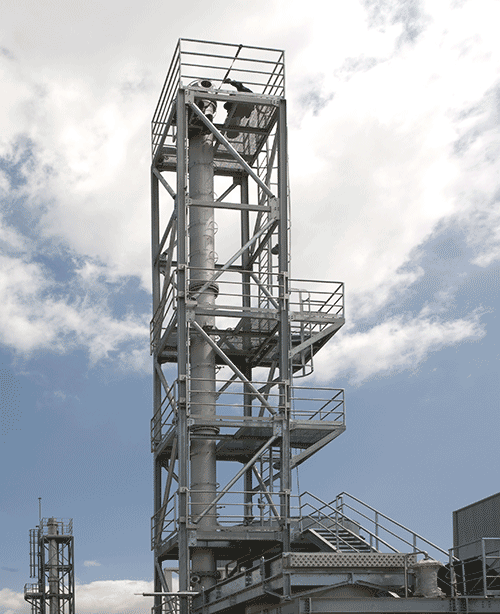
| Reduce the amount of waste generated by 1,800 tons per year | Reduce waste generation by installing an ethanol distillation tower.
Reduction of 1,785 metric tons per year. |
|
| Reduce the amount of plastic waste generated in waste and raw material conditioning.
Reduction of 75 metric tons per year. |
||
| Reduce the amount of cardboard waste generated in plasma storage and reagent conditioning. Reduction of 5 metric tons per year. Reduce single-use cups in cafeteria. Reduction of 2 metric tons per year. |
||
| Increase consumption of recycled material | Implement the use of recycled cardboard in packaging material. | |
| Biodiversity | ||
| Establish biodiversity protection programs in Grifols' natural areas and other areas of influence | Protect the biodiversity of the natural area located within Grifols’ facilities by maintaining the Wildlife Habitat Council (WHC) certification. | 100% |
|
Protect the biodiversity of our areas of influence through agreements with external entities: - Rivus Foundation for the conservation of river systems and their heritage. - Associaciò Sèlvans for the protection of a centennial forest of recognized ecological value. |
||
Access to the 2023-2026 Corporate Environmental Program
More details on progress and compliance with environmental commitments related to the SDGs: “Sustainability and Human rights”.
Climate action
Grifols’ commitment to climate action is driven by the Board of Directors.
In its pursuit to help protect the environment, Grifols sets targets to effectively reduce atmospheric emissions; assess its impact on climate change, identifies risks and opportunities; and develops a policy and strategy to reduce impacts and leverage opportunities.
The impact of climate change on Grifols
In 2023, Grifols updated the figures regarding risks and opportunities identified in 2019 in line with the recommendations of the Task Force on Climate-Related Financial Disclosures (TCFD). Parallel to this, it redefined the specific metrics and targets to quantify and manage each climate risk and opportunity, based on four key dimensions: Governance, Risk Management, Strategy, and Metrics and Objectives.
Furthermore, it is analyzing its ability to surpass TCFD recommendations in its four broad areas, while continuing to integrate relevant climate-related risks in its current decision-making process and strategic planning, including assumptions and targets.
| Risks and associated financial impacts | Key indicators | |
 |
1. Reduced availability of water resources
|
Water consumption (m³) Water costs (€) per system Production capacity (liters of plasma in Biopharma and sales in Diagnostic) |
 |
2. New legal requirements related to reducing GHG emissions
|
Carbon footprint / Atmospheric emissions (tCO2e) Carbon price (€/tCO2e) |
 |
3. Variation in the availability of resources
|
Revenue per liter of plasma (€/L) Number of days closure at primary donation centers in the last year |
 |
4. Transition to low-emission technologies
|
Electricity consumption (MWh) Electricity costs per plant (€) Natural gas consumption (MWh) Natural gas costs per plant (€) Residual price of replaced technology (€) |
More details on “Risk Opportunities Management related to Climate Change”: Grifols corporate website at www.grifols.com
The impact of climate change on Grifols
Governance
See section “Environmental Governance and Climate Change Action”.
Risks and opportunities
This involves updating the climate risk map and analyzing the qualitative and quantitative resilience of Grifols’ strategy based on a potential maximum rise of 2°C. A simulation of the climate scenarios proposed by the IPCC was carried out to reflect the SSP2-RCP4.5 scenario.1 The exposure study included Grifols’ most relevant industrial facilities and plasma centers. The materialization time horizon, probability of occurrence, and inherent and potential residual impact were evaluated for the 29 detected climate risks. While the risks and opportunities identified are still not significant, the company nonetheless reassessed the suitability of the specific management plans defined.
Strategy
Business optimization and innovation are cornerstones of Grifols’ corporate strategy. Both are underpinned by climate-change objectives, defined in the Corporate Environmental Program and promoted through climate-action and other policies. Climate risks and opportunities form an integral part of Grifols’ strategy and decision-making process.
Climate risks and opportunities have a direct impact on Grifols’ business and financial strategy and planning, especially in areas related to industrial activity, operations, products and services. For this reason, climate change is included in operational cost planning and capital allocations, mainly in terms of implementing eco-efficiency and emission reduction measures. Grifols fully complies with existing regulatory requirements, implementing procedures to ensure compliance (EV-SOP-00004). The environmental management system of certified companies is audited every six months, with appropriate measures taken by Grifols environmental committees.
Metrics and targets
Grifols evaluates and monitors environmental targets2 attained and their impact on mitigating relevant physical risks and leveraging key opportunities. Regarding the linkage between compensation policy and performance indicators, the energy manager has incentives tied to the increase in renewable energy through Power Purchase Agreements (PPAs). Every year, Grifols participates in the Carbon Disclosure Project (CDP),3 which assesses the organization’s climate-action strategy, transparency and performance.
(1) More details of the study conducted, including the specific list of climate risks under the SSP2-RCP4.5 scenario and specific impact: Corporate Responsibility Reports. www.grifols.com
(2) More details and information on compliance with the Environment and Master Plans: 2023-2026 Corporate Environmental Program. Further details on the progress of environmental commitments related to the SDGs are available in the chapter on Sustainability and Human Rights.
(3) Grifols’ Environmental CDP performance results can be accessed on www.grifols.com
Grifols is a member of high-profile business associations dedicated to fight climate change
The Biotechnology Innovation Organization (BIO) advocates for biotechnological solutions in four key areas: sustainable biomass production, promoting sustainable production, developing lower carbon products and improving carbon capture. Grifols also belongs to other global organizations such as MedTech Europe, Asebio and SIGRE, who prioritize climate change on their agendas.
More on partnerships: “About this Report”.
Emissions
![]()
204,564
t CO2e Scopes 1 and 2 (market based)
33%
reduction in CO2e emissions intensity for Scopes 1, 2, and 3*
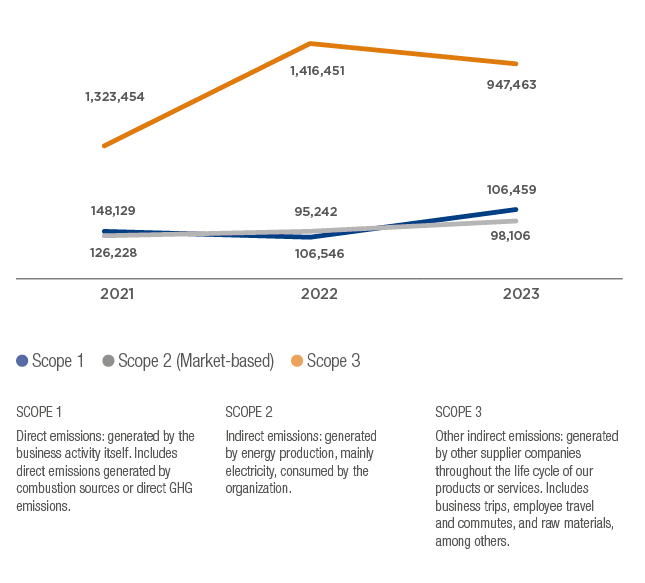
Evolution of Grifols’ carbon emissions
* Decrease in relation to sales. Market-based emissions.
Grifols uses the GHG Protocol Corporate Accounting and Reporting Standard methodology to calculate its carbon footprint and identify the greenhouse gas emissions (GHG) generated by its business activity.
The data reported includes all Grifols’ global facilities, as well as acquisitions in 2023 and commercial subsidiaries with more than 10 employees.
Since 2011, the company has published its Scopes 1 and 2 CO2e emissions, and a thorough Scope 3 inventory since 2021, with a focus on the highest-priority categories. In this regard, the company has quantified and conducted regular screening and materiality assessments in line with GHG Protocol.
Grifols has defined decarbonization targets for Scopes 1, 2 and 3. Updated every three years, the Corporate Environmental Program outlines short-term intermediate decarbonization targets and milestones. Grifols has clear goals established in its 2030 Agenda, including efforts to reduce carbon emissions per unit of production or per business trip. Additionally, in 2023 Grifols committed to implementing near-term targets aligned with the Science Based Targets Initiative’s (SBTi) 1.5ºC goal.
Key impacts
- Scope 1 increased by 12% compared to 2022, reaching 106,450 tCO2e due to the increased operational days of the cogeneration plantwhich has been operational throughout the year.
- Scope 2 emissions decreased by 8% (according to the market-based approach), reaching 98,106 tons of CO2e, thanks to the increased use of renewable energy. However, if we applying the location-based methodology and excluding renewable energy efforts, emissions increase by 30%, reaching 136,237 tons of CO2e, due to an improved accounting methodology.
- Scope 3 emissions decreased by 33% compared to 2022, totaling 947,463 tons of CO2e. Category 1 (goods and services) remains responsible for over 50% of the emissions, followed by Grifols contracted transportation.
- By geographical areas, over 64%* of emissions originate in the United States, where 67% of Biopharma activity occurs. The remaining 36% is divided between Spain and the rest of the world (market-based).
- In all plants, atmospheric emissions of other pollutants such as NOx, CO and SO2, mainly generated by natural gas combustion in boilers and cogeneration engines, are below the established limits by the relevant environmental authorities. They are also are below the legal limits established for VOCs in ethanol facilities.
- Grifols does not produce, import or export ozone-depleting substances (ODS).
* Scope 1 and 2
|
Action plan: Bringing us closer to our goal of reducing GHG emissions by 55% per unit of production by 2030 with 2018 as base year |
|
| Cutting back on air travel | Air travel has continued to decline in 2023, down 33% from pre-pandemic levels (2019) although up 22% from 2022. The number of video calls made in 2023 was 38% higher than in 2019 and 5% higher than in 2022. These new ways of working have helped to minimize travel among Grifols’ different locations. |
| Increase in remote work | In 2023, the number of employees working remotely increased by 5% compared to 2022 and by 525% compared to 2019, averaging 3,000 per day. In 2022, the flexibility policy regulated remote work options. |
| Optimizing logistics |
Grifols has been working to optimize its plasma transport network in Europe since 2021 to minimize its environmental impact. The measures implemented to date have enabled the company to reduce its contracted transport services by more than 290,000 km. These initiatives include adjusting the frequency of plasma collection routes in European workplaces; promoting full truckloads between plasma collection points, warehouses and the Barcelona manufacturing complex; increasing the storage capacity of plasma collection containers; and using larger U.S. pallets to optimize storage and transport, among others. Intermediate products are now transported from the Clayton (North Carolina, U.S.) plant to the Dublin (Ireland) plant by sea instead of by air, helping to reduce CO2e emissions by more than 3,400 t per year. |
| Minimizing the impact of employee travel | Grifols works to reduce the impact of emissions resulting from employee commutes. The Barcelona facilities offers various employee bus services to coincide with different shift times, while in North Carolina, Grifols co-funds a shared transport service. In recent years, electric vehicle chargers have been installed in the main workplaces. The company is working on a global vehicle fleet policy to promote the use of low-emission vehicles. |
| Commitment to renewable energies |
Grifols is reducing its emissions and increasingly relying on renewable energies, which now account for 37.7% of energy consumption. The goal is to reach 100% by 2030, which will require purchasing green energy and promoting new electricity-generation assets. Grifols reinforced its commitment to renewable energies by taking out Power Purchase Agreements (PPAs) in the countries where the company has a major industrial presence. Grifols’ Casa Valdés photovoltaic plant in Spain became operational in 2022 and was included in the 10-year PPA signed with RWE in 2021. The agreement included a purchase of 26 million kWh per year, which will avoid 5,200 t of carbon emissions. In the U.S., more than 119 million kWh of electricity was consumed with guaranteed renewable energy, in Ireland more than 11.5 million kWh and in Germany 0.3 million kWh. |
Energy sources: responsible consumption
TOTAL ENERGY CONSUMPTION
928
M kWh
+4% vs 2022
55% natural gas
44% electricity
1% other fuels
0% carbon
CONSUMPTION RELATIVE TO SALES
152,534
kWh/M€
-2% VS 2022
- Total energy consumption remained at similar levels to 2022, increasing by 4% due to higher production rates.
- The increase in sales over and above the increase in energy consumption represents a 2% reduction in consumption relative to sales.
- Progress is being made to optimize energy consumption at Grifols Biopharma facilities.
- The positive impact resulted in a 12% fall in consumption relative to production in the Biopharma and Plasma Procurement business unit.
Artificial intelligence to reduce our impact
Artificial intelligence (AI) is helping Grifols’ facilities work more efficiently. Integrating this technology has led to a more than 15% drop in energy consumption in air conditioning in the production facilities at the Parets del Vallès (Barcelona, Spain) Diagnostic Unit. Air conditioning is one of the company’s main sources of electricity consumption, and technology can offer ways of reducing it, which inspired the launch of the “Energy Efficiency Through AI” pilot project in 2022. The company is working to replicate this project at the production facilities in Barcelona and Clayton, North Carolina, which also consume significant energy in air conditioning.
Natural gas
Greater eco-efficiency in a context of productive growth
![]()
508
M kWh consumed
+13%
vs 2022
Evolution of total natural gas consumption (Millions kWh)
Favorable impact of Biopharma
- Consumes 86% of all Grifols’ natural gas usage.
- The 35 M kWh increase in absolute gas consumption is due to increased production rates in the cogeneration plant and accounts for a 4% rise in relation to sales and a 4% fall in relation to production*.
Diagnostic consumption remains stable
- Diagnostic consumption levels remains stable in absolute value and relative to production and sales.
Variations at country level
- In Spain, the rise in consumption is mainly due to increased activity at the cogeneration facility and an increase in Biopharma’s production.
- U.S. up 6% mainly due to Biopharma plant, which increased production by 14%.
- In the rest of the world, there has been a slight increase in consumption due to production tests at both the Canadian and Irish facilities.
Other fuels
Although to a lesser extent, Biopharma also consumes other fuels besides natural gas, including diesel, gasoline and propane to run its own generators, equipment and vehicles. This accounted for 4.6 million kWh of consumption in 2023. Additionally, some of Grifols’ German facilities use district heating for hot water and heating. In 2023, this system consumed 10.4 million kWh. Grifols does not consume coal.
* In terms of consumption relative to production and sales, Biopharma includes the Plasma Procurement and Biopharma business units, which together would be comparable to the former Bioscience Division.
More details on natural gas consumption are included in the tables at the end of this chapter.
Electricity
Consumption is falling in a context of rising rates of production.
By 2030, 100% of the electricity consumed will come from renewable sources.
![]()
445
M kWh consumed
-1.2%
vs 2022
Evolution of total electricity consumption (Millions kWh)
Positive impact of Biopharma
- Consumed 63% of all electrical energy used
- Total consumption fell by 1%
- Down 9.1% relative to sales*
- Up 16.6% relative to production*
Diagnostic reduced total consumption
- 5.9% decrease for the second consecutive year
- 5.8% increase relative to production and sales
Variations at country level
- Down 2.6% in the U.S.
- Up 2.3% in Spain and the rest of the world due to the increase in production
* In terms of consumption relative to production and sales, Biopharma includes the Plasma Procurement and Biopharma business units, which together would be comparable to the former Bioscience Division.
More details on electricity consumption, see the tables at the end of this chapter.
Renewable energies
A key area of emphasis
![]()
34.3%
of Grifols’ total electricity consumption derives from renewable energy sources
2022: 26.4%
2021: 8.3%
13,6% Spain
78,6% United States
0,2% Germany
7,6% Ireland
Increase in electricity consumption from renewable sources
In 2023, Grifols consumed a total of 152.6 million kWh of renewable electricity, representing 34.3% of total electricity consumption.
Spain consumed 20.7 million kWh of renewable electrical energy
Roughly 20.2 million kWh of renewable energy came from the Casa Valdés photovoltaic park, included in the 10-year Power Purchase Agreement (PPA) signed with RWE in 2021. In 2023, 453,471 kWh of photovoltaic energy was generated at Grifols’ own facilities for self-consumption in Barcelona and Murcia.
Grifols continues to pursue agreements to construct new photovoltaic park to increase the levels of renewable energy consumed in Spain and other European countries.
Driving renewable electricity consumption in the U.S. and Ireland
By region, 70% of the group’s electrical energy is consumed in the U.S., home to several of its industrial complexes and the majority of its plasma donation centers. More than 119.9 million kWh of electricity was consumed with guaranteed renewable energy (80 million kWh in 2022), and more than 11.5 million kWh in Ireland. The German sales offices consume the remaining 340,000 kWh of renewable energy from guaranteed sources.
| Renewable energy per source and country* | ||||
| PPA (Power Purchase Agreements) / kWh | Guarantees of origin / kWh | Own photovoltaic plants / kWh | Total / kWh | |
| Spain | 20,273,875 | 0 | 453,471 | 20,727,346 |
| United States | 0 | 119,999,113 | 0 | 119,999,113 |
| Germany | 0 | 340,000 | 0 | 340,000 |
| Ireland | 0 | 11,529,794 | 0 | 11,529,794 |
| Total | 20,273,875 | 131,868,907 | 453,471 | 152,596,253 |
Cogeneration
Enabling the production of electricity and heat for Biopharma
![]()
9%
of total electricity consumption is generated in the Barcelona facility’s cogeneration plant
Biopharma’s Barcelona facilities are equipped with a 6.1 MW cogeneration plant, which generates electricity sold back to the grid, as well as producing useful heat for Grifols’ own facilities. This plant generated 40.6 million kWh of electricity in 2023, denoting a 47.2% increase over the previous year. The cogeneration plant was not yet fully operational in 2022. The useful heat recovered amounted to 30.4 million kWh.
More details on consumption from the cogeneration plant, see the tables at the end of this chapter.
Circular economy
Grifols’ environmental management is guided by the notion of the circular economy, which aims to reduce the consumption of raw materials, water and energy sources in the production cycle. The company prioritizes the efficient use of resources and works to reduce waste by focusing on the different stages in the product and services life cycle. The goal of this strategy is to embrace the transition to a low-carbon economy and minimize the impact on climate change.
Waste
- Residual waste recovery
- Energy recovery from waste
- Anaerobic digestion
- Zero Waste to Landfill initiative
- In-house wastewater treatment
- Minimization of atmospheric emissions
Raw Materials
- Rationalization of cardboard, plastic and caustic soda consumption
- Maximum utilization of raw materials
- Prioritizing local suppliers
- Route optimization
Design
- Environmental criteria in engineering projects
- Eco-design of equipment (diagnostics and engineering)
- Environmental criteria in R&D
- Packaging design
Production, Remanufacturing
- Water recovery systems
- Optimized water consumption
- Energy efficiency
- Renewable energy consumption
- Cogeneration plant
- LEED/Green Globes building certification
Recycling
- Recycling of recoverable waste
- Internal reuse of ethanol for production
- Recovery of intermediate products
- New biological products marketed by the Bio Supplies Business Unit
Collection
- SIGRE, Integrated Management System for drugs out of specification
- Management of electric and electronic equipment placed on the market
Consumption, Use, Reuse, Repair
- Reuse of ethanol in production
- Intermediate products: PEG + sorbitol
- Grifols Engineering machine manuals
- Equipment manuals (diagnostic)
Distribution
- Optimization of packaging
- Recycled/recyclable packaging materials
- Certification of transport companies
- Optimization of routes and means of transportation
Consumption of raw materials
Plasma is the main raw material consumed by Biopharma, accounting for more than 85% of Grifols’ activity in terms of sales revenue. Ethanol, polyethylene glycol and sorbitol are primarily used in the fractionation and purification process of the different plasma proteins.
Through plasma fractionation, proteins with therapeutic properties are extracted and subsequently marketed by Grifols. This process involves subjecting the plasma to successive temperature, pH and ethanol concentration adjustments, each of which facilitates the precipitation of one of these proteins.
In the Diagnostic Business Unit, the main raw material is the plastic used in the production of its diagnostic cards (DG-Gel®), in addition to the base plates to manufacture auto-analyzers.
Maximum reuse of plasma
Most of the plasma deemed unsuitable for fractionation is marketed through Bio Supplies to produce diagnostic and analytical reagents for research purposes. By 2023, more than 140,000 liters of plasma had been sold, resulting in the annual reuse of 145 tons of raw materials and consequently, the same volume in waste reduction.
Once all plasma proteins for therapeutic purposes have been obtained, the remaining paste is disposed of as waste and managed according to its composition and country: anaerobic digestion for the production of biogas; composting; controlled landfill for non-hazardous waste; or autoclave treatment and subsequent landfill disposal.
Management of intermediate products in Biopharma
A solution of polyethylene glycol (PEG) and sorbitol is used to separate and obtain Flebogamma® DIF intravenous immunoglobulin. After use, this solution is concentrated at Grifols’ Barcelona facilities and marketed to additive manufacturers for use in the cement industry. In 2023, approximately 18,500 tons of aqueous solution of polyethylene glycol and sorbitol were transformed into 6,175 tons of product that is sold as raw material for other uses.
Reduction of plastics in our production processes
The company implemented a number of measures in 2023 aimed at optimizing processes to minimize the use of plastics, which is among Grifols’ top priorities. These included removing the polyethylene bag in each box of plasma archive samples, which saves 20,600 bags/year, equivalent to 0.642 t of plastic/year. It also modified the conditioning of the waste from ethanol production pastes to eliminate the use of plastic buckets, which have resulted in a saving of 75 tons of plastic per year.
At the Diagnostic Business Unit’s production center in Australia, plastic gloves have been replaced by biodegradable gloves. Likewise, 55% of the gloves used in the U.S. plasma donation centers are biodegradable.
More details on main raw material consumption, see the tables at the end of this chapter
Water cycle
Grifols rationalizes water consumption in a context of industrial growth.
Cost-saving measures are implemented in 73% of production facilities.
![]()
3.6
M m3 consumed
+21% vs 2022
Grifols operates in regions where water conservation is essential. The company incorporates water-saving measures into the design of new facilities in addition to implementing solutions in existing facilities. These include the recovery of clean water from production processes for use in auxiliary processes, the installation of automated cleaning systems (CIP) to reduce the amount of water used to clean reactors and equipment, and reduced consumption in water treatment systems such as reverse osmosis.
Positive impact of Biopharma
- Accounted for 84% of the total water consumption
- Consumption rose by 8% at the Spanish facilities, well below the 19.4% increase in production. Figures for the production facilities rose 4.1% relative to production* and 13.4% relative to sales.
Diagnostic decreased consumption
- Fell by 34.3% in absolute value and relative to production.
- This decrease is due to the measures implemented, the production stoppage in Brazil.
We make rational use of water resources
- Water-stressed regions accounted for 20.1% of Grifols’ water consumption, maintaining similar levels to those recorded in previous years.
- Of the total water consumed, 89.3% comes from the municipal network and the remaining 10.7% from wells located at the Barcelona production facilities.
- Water is extracted from wells under regulations set by the water basin management company, which controls all permits andwater usage. Grifols monitors these extractions to ensure the company is well within the authorized limits.
Evolution of total water consumption (Thousand m3)
*In terms of consumption relative to production and sales, Biopharma includes the Plasma Procurement & Biopharma business units Biopharma, which together would be comparable to the former Bioscience Division.
More details on water consumption are available in the tables at the end of this chapter
Wastewater and discharge management
Grifols adheres to all applicable national and local regulations and permits regarding the disposal and treatment of wastewater at its facilities. All wastewater is sent to local sewage systems where it is treated by municipal or regional facilities. Grifols’ industrial plants pre-treat the water to suitably purify it before its disposal, and all are located in areas where the local authorities monitor water discharge. Manufacturing plants with environmental management systems and/or certified companies have instructions on how to prevent, control and monitor the quality of wastewater. Commercial offices and warehouses discharge wastewater into the municipal sewage system.
In 2023, 2.4 million m3 of wastewater was discharged to public sewers. In U.S. plants, stormwater is conveyed to public waterways including the Los Angeles River, Neuse River and San Francisco Bay. Approximately 34% of water is consumed in auxiliary processes such as cooling towers or incorporated into the product, while 66% is discharged to the sewer.
In 2023, the Barcelona and Clayton (North Carolina) facilities treated 849,191 m3 of wastewater using biological systems prior to discharge, representing 35% of the total discharge. Projects are underway to expand these treatments at both plants and in 2023, the new Clayton and Barcelona wastewater plants came into operation.
In water-stressed areas, the distribution of discharges corresponds to water consumption, with no significant variations from previous years. Chemical oxygen demand (COD) is the most significant discharge parameter. This is defined as the amount of organic and inorganic matter susceptible to oxidation. In 2023, 2,168 tons of COD were discharged, most of which corresponded to Biopharma’s production facilities. In addition, 326 tons of suspended solids were discharged.
Grifols does not work with genetically modified organisms or with products capable of generating persistent organic compounds, and consequently, generates no discharge of this nature. The contribution of nitrogen or phosphorous to wastewater is insignificant since it comes mainly from sanitary and non-production-related discharges
We treat discharged water
The anaerobic treatment plant at the Biopharma facilities in Barcelona was recently enhanced with UASB (Upflow Anaerobic Sludge Bed Reactor) technology. This treatment process is carried out in a highly efficient reactor which reduces 85% of the organic pollutant load in the absence of oxygen with minimal energy consumption, generating biogas of renewable origin. Once treated, this biogas is used as fuel for the plant’s steam production boilers, thus reducing natural gas consumption and CO2 emissions into the atmosphere. This facility will double the plant’s current wastewater treatment capacity in order to reduce the current final discharge parameters or maintain them in the event of production increases.
Biopharma’s North Carolina facility has a new wastewater treatment plant with the capacity to process up to 5,678 m3 per day. This facility is the largest treatment plant in Grifols’ global facilities and reduces the organic load of treated water to 250 mg per liter, equivalent to that of a household. Today, with this new highly efficient plant in operation, the water treated by Grifols only contains 50 mg of organic load per liter, one-fifth of the total amount permitted.
![]()
34%
water incorporated into the product and used or consumed in auxiliary processes
Average value
66%
is discharged into the sewers
Average value
2.4 M m3
Total water discharge
+4.1%
35%
of Biopharma’s wastewater is treated prior to being discharged
-14%
COD discharge
-9%
suspended solids discharge
More details of water consumption and discharges, see the tables at the end of this chapter
Waste
Grifols’ waste management strategy prioritizes waste prevention and reduction, and favors its recovery over landfill or incineration.
![]()
25,479
metric tons of recovered waste
50% of the total waste generated
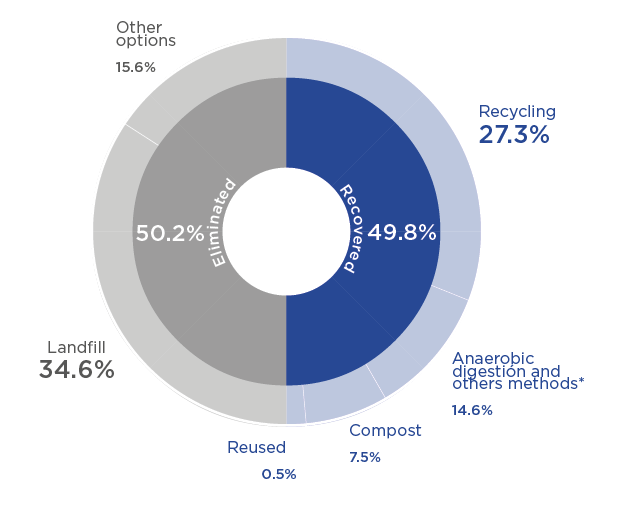
Grifols continues to explore waste management treatments with recycling initiatives, anaerobic digestion, and material and energy recovery.
Biopharma’s industrial facilities generated 21,067 tons of waste, up 26% over the previous year in line with an increase in production. The volume of waste from other facilities such as donation centers and offices amounted to 30,052 tons. General waste from donation centers has increased due to new data collection methods. In 2023, data is available directly from the supplier.
In 2023, 50% of Grifols’ waste was not allocated for disposal, of which 8% was hazardous waste, representing 3.9% of the total, and 92 percent was non-hazardous. The 2023-2026 Environmental Program includes waste reduction targets, including a plan to install an ethanol distillation tower to reduce 1,785 metric tons of waste per year in Germany’s facilities.
*Includes anaerobic digestion, other methods with energy recovery and by-products
We prevent 99% of our waste from reaching landfill
Biopharma’s industrial facilities in North Carolina avoided 99% of waste from reaching landfill and used incineration with energy recovery for a maximum of 5% of its waste. With these results, the complex continued to hold the highest rating in the “Zero Waste to Landfill Gold Operations” certification.
In 2021, the facilities in Spain made headway in waste recovery by changing the final destination of a large part of general waste. This meant that all recoverable waste would be managed separately, and only waste that could not be recovered or recycled due to its composition and applicable legislation, would be sent to landfill or incinerated. This change has progressively reduced the amount of waste disposed of in landfills.
In 2023, waste directly sent to landfill was reduced by 50 tons compared to 2022. Waste is sent to authorized waste management for disposal.
In 2023, reports were requested from CHWMEG in the U.S., an independent auditor for waste disposal companies.
For more details on disposed, recycled and reused waste, see the tables at the end of this chapter.
Medicine waste management
Most Grifols products are used in hospitals, which have their own recycling and disposal criteria established by local health authorities.
Grifols products designed for domestic use are dispensed in pharmacies or by hospital suppliers, each of which has its own procedures regarding the safe collection and disposal of self-injectable devices. Grifols participates in various drug waste management programs.
- Spain: SIGRE program manages the collection of household medicine packaging and waste to ensure it is safely treated to protect the environment.
- United States: Pharmaceutical Product Stewardship Working Group (PPSWG) serves as a platform to organize and present science-based data on safe disposal practices for pharmaceuticals and implements industry efforts to raise awareness of appropriate disposal methods.
For medicines that end up not being marketed or returned, Grifols uses waste handlers who separate and classify medicine packaging (paper, cardboard, glass, plastics, etc.) to be recycled by specialized companies. The medicines themselves are disposed of through an authorized waste management company, using incineration methods and incineration with energy recovery.
Grifols’ main products are plasma medicines for intravenous, intramuscular or subcutaneous administration in healthcare centers. The biological origin of plasma medicines limits their impact on the environment since waste is primarily generated from their containers and packaging, most of which can be recycled. The drug package leaflets indicate the correct waste management practices for country-specific legislation.
More details on waste management, see tables at the end of this chapter.
Clayton awarded “Zero Waste to Landfill” certification for 5th consecutive year
The Clayton (North Carolina) plant was awarded the “Zero Waste to Landfill” certification for the fifth year in a row by Underwriters Laboratories (UL), achieving Gold status. This means that 99% of the waste it generates is not sent to landfill but recycled, composted, anaerobically digested or otherwise recovered using specific waste management techniques. This is an example of Grifols’ Circular Economy Strategy aimed at reducing waste and pollution.
Biodiversity
Protecting biodiversity on Grifols-owned land through Grifols’ Wildlife programs is one of the company’s environmental priorities.
Grifols’ Wildlife programs are focused primarily on launching various initiatives in the Clayton (North Carolina) protected natural area. A collaboration agreement for the conservation of two river basins in Catalonia (Spain) is also still in force.
Under its Environment Management System, Grifols assesses potential environmental risks at its U.S. facilities (Clayton), particularly its impact on biodiversity.
Natural protected area in North Carolina
Grifols owns over 121 hectares of forest adjacent to its production facilities in Clayton, North Carolina. This is an ideal habitat for many aquatic and terrestrial species and is certified by the Wildlife at Work and Corporate Lands for Learning programs, both of which were launched by the Wildlife Habitat Council (WHC).
Conservation projects* carried out in 2023 include:
- Collaboration with local students to help maintain the birdhouses for native bird species, contributing to nesting, breeding and shelter.
- Continued protection of an extensive wooded area adjacent to Grifols’ facilities that had been earmarked for development, to preserve it as a habitat for wildlife and keep it as a recreational area for environmental education for the workforce. In 2023, bridges were installed to provide access for disabled users and the trails were cleaned and maintained. Grifols contributes to preserving forest-dependent fauna and plant diversity and eliminating invasive species in the area.
- Two “Year of the Trail” events were held in 2023, welcoming around 100 people to take part in trail hikes.
Management of prairie flora and fauna has continued, including the installation of birdhouses for local birds and bats and the removal of non-native plant species. This contributes to preserving dependent fauna, plant diversity in the area and eliminating invasive species.
- Improvement and maintenance of a pollinator garden for the development of five active hives. In 2023, additional native fauna was planted in the garden and 35 Grifols employees were trained in the care of bees and hives. This contributes to raise awareness and maintain diversity.
* Includes the main projects carried out for each of the programs.
![]()
We preserve 121+ hectares. equivalent to more than 150+ football fields
Main projects underway
Under these programs, several volunteer projects and activities are carried out throughout the year, aimed at protecting biodiversity and for educational purposes. There are currently six active projects:
Bluebird Boxes - Avian
Clayton WHC forestall - Forest
Clayton WHC meadow - Grassland
Clayton WHC Pollinator Garden - Landscape
Clayton WHC bee training for employee - Training
Clayton WHC wetlands and bodies of water - Wetlands and water bodies
Clayton Forest awarded GOLD certification by Wildlife Habitat Council
For the first time since 2008, Grifols was awarded the GOLD status conservation certification for the natural area surrounding the Clayton facility. This is the highest level awarded by the U.S. Wildlife Habitat Council in recognition of the company’s staunch commitment to sustainability and efforts to protect biodiversity.
Conservation and preservation of river systems in Spain
In 2023, Grifols renewed its collaboration agreement with the RIVUS Foundation, dedicated to research, education and volunteer projects to promote the conservation of natural areas, particularly the Besòs and Tordera river basins. Grifols supports the Foundation’s awareness programs in local schools in reflection of its environmental commitment and desire to give back to the community.
The projects launched in 2023 entailed environmental education, outreach and training for students and the general public. Some of the main highlights included:
Educating children on the importance of the river environment
The “Discover the river” program for the 2022-23 academic year included 15 activities, welcoming 5,432 students from 90 schools in 33 towns located on the Besòs and Tordera river basins.
Raising awareness of the importance of the Tordera river basin
The RIVUS Observatory’s Environmental Education, Communication and Training Program (PROECA) is aimed at educational centers, and includes programs to teach sampling methodologies to schoolchildren and other initiatives at the university level. In 2023, 600 people benefited from these offerings.
Sergi Mingote Academic Paper Award
This award is given in recognition of outstanding research work on water or river systems carried out by high school and vocational training students. To date, more than €2,000 have been awarded in prize money.
The importance of river basin restoration
“H2O Connecta: Environmental Education, Outreach and Training on Water and River Systems” is a project aimed at connecting the general public with knowledge of their local rivers. Over 350 people participated in conferences and workshops, guided tours and the traveling exhibition in 2023.
Protection and preservation of the “Grifols Centennial Forest”
In 2023, Grifols signed a sponsorship agreement with the Associació Sèlvans, which works to preserve natural forest heritage considered particularly unique and valuable, and occupy a minimum of 5% of the finest forest area in Catalunya, Spain. Grifols’ support will span 2023 and 2024 with three main objectives: preserve the “Grifols Centenary Forest” as a natural environment to promote people’s health and well-being; offer a home and refuge for extraordinary biodiversity; and model positive action in the face of the climate crisis.
The “Grifols Centennial Forest” is an area in danger of being designated for commercial logging and therefore in urgent need of protection. The 40-hectare forest is located in the Garrotxa Natural Volcanic Park about 100 kilometers from Grifols Barcelona facilities.
A preliminary custody agreement ensures its preservation for the time-being and opens up the possibility of a long-term conservation (minimum 25 years).
Grifols has developed several initiatives through this sponsorship to raise awareness on the need to preserve the natural environment. These include co-organizing Grifols 2023 World Environment Day; launching training programs, such as a country walk for employees and their families to foster greater knowledge of the natural environment and its biodiversity; and designing a forestry itinerary and adapting it to provide forest therapy, among others.
Tree sponsorship in Germany
Employees from Grifols’ donation centers in Germany commemorated World Environment Day by donating to the “Ecken Wecken” Foundation and participated in a tree sponsoring project near its headquarters in Leipzig. They also helped plant flowers around the trees, all in an aim to improve biodiversity.
Bee conservation in Ireland
In 2023, Grifols partnered with the Irish Bee Project to support environmental conservation and help protect biodiversity at its main site in Ireland. This collaboration targets the preservation of Ireland’s indigenous bees and pollinators for future generations. The project involved establishing a bee sanctuary at Grifols’ Dublin site, providing bees with a secure environment, featuring custom-built nests and appropriate plant life.
As pollinators, bees play an essential role in our ecosystem, contributing to the growth of trees, flowers and other plants, and foster the development of complex, interconnected ecosystems. This fosters a balanced ecosystem in which diverse species coexist.
Environmental key performance indicators
Environmental expenses and investments
| ENVIRONMENTAL EXPENSES | |||
| In thousands of euros | 2023 | 2022 | 2021 |
| Waste management | 21,290.00 | 17,544.51 | 13,236.70 |
| Water cycle | 6,660.11 | 7,893.98 | 6,975.50 |
| Reducing atmospheric emissions and energy | 84.00 | 57.69 | 62.90 |
| Others | 0.00 | 290.63 | 367.20 |
| Total | 28,034.11 | 25,786.81 | 20,642.30 |
| ENVIRONMENTAL EXPENSES - BIOTEST | |||
| In thousands of euros | 2023 | 2022 | |
| Water cycle | 1,594.00 | 0.00 | |
| Reducing atmospheric emissions and energy | 0.00 | 795.30 | |
| Total | 1,594.00 | 795.30 | |
| ENVIRONMENTAL INVESTMENTS | |||
| In thousands of euros | 2023 | 2022 | 2021 |
| Waste management | 427.11 | 2,275.40 | 433.60 |
| Water cycle | 518.46 | 1,263.40 | 2,848.70 |
| Reducing atmospheric emissions and energy | 2,575.37 | 1,502.60 | 1,580.60 |
| Others | 1,253.39 | 3,331.00 | 2,500.30 |
| Total | 4,774.33 | 8,372.40 | 7,363.20 |
| ENVIRONMENTAL INVESTMENTS - BIOTEST | |||
| In thousands of euros | 2023 | 2022 | |
| Water cycle | 0.00 | 0.00 | |
| Reducing atmospheric emissions and energy | 1,000.00 | 0.00 | |
| Total | 1,000.00 | 0.00 | |
Emissions
| EMISSIONS | ||||||||||||
| % | 2023 | Spain | U.S. | RoW | 2022 | Spain | U.S. | RoW | 2021 | Spain | U.S. | RoW |
| Scope 1 | 106,459 | 31.5% | 60.3% | 8.2% | 95,242 | 30.4% | 61.9% | 7.7% | 148,249 | 21.9% | 71.2% | 6.9% |
| Scope 2 (Location-based) | 136,237 | 11.3% | 80.6% | 8.1% | 105,068 | 9.3% | 83.5% | 7.3% | 150,277 | 4.5% | 84.7% | 10.8% |
| Scope 2 (Market-based) | 98,106 | 106,545 | 126,228 | |||||||||
| Scope 3 | 947,463 | 22.8% | 53.0% | 16.7% | 1,416,451 | 16.9% | 64.4% | 18.8% | 1,323,454 | 24.2% | 71.2% | 4.6% |
| EMISSIONS - BIOTEST | ||||||||||||
| % | 2023 | Germany | Spain | U.S. | RoW | 2022 | Germany | Spain | U.S. | RoW | ||
| Scope 1 | 18,300 | 94.7% | 0.0% | 0.0% | 5.3% | 12,283 | 99.4% | 0.0% | 0.0% | 0.6% | ||
| Scope 2 (Market-based) | 15,464 | 90.3% | 0.0% | 0.0% | 9.7% | 6,523 | 94.8% | 3.1% | 0.0% | 2.1% | ||
| Scope 3 | - | - | - | - | - | - | - | - | - | - | ||
| TOTAL EMISSIONS BY ORIGIN | |||
| Gross T CO2 e | 2023 | 2022 | 2021 |
| Scope 1 | 106,459 | 95,242 | 148,129 |
| Natural gas | 93,099 | 82,536 | 86,403 |
| Fugitive emissions | 10,131 | 10,749 | 59,406 |
| Other fuel (gasoline, diesel and propane) | 3,228 | 1,957 | 2,320 |
| Scope 2 Location-based | 136,237 | 105,068 | 150,276 |
| Scope 2 Market-based | 98,106 | 106,546 | 126,228 |
| Electricity | 134,357 | 103,322 | 147,975 |
| Electricity (market-based) | 96,226 | 104,800 | 123,927 |
| District heating | 1,880 | 1,746 | 2,301 |
| Scope 3 | 947,463 | 1,416,451 | 1,323,454 |
| Purchased goods & services | 546,309 | 765,443 | 697,287 |
| Capital goods | 86,084 | 198,034 | 237,955 |
| Fuel & energy related activities | 54,536 | 56,971 | 52,666 |
| Upstream transportation | 156,333 | 216,062 | 172,501 |
| Waste management | 10,814 | 7,021 | 7,373 |
| Business travel | 20,432 | 22,780 | 10,062 |
| Employee commuting | 37,810 | 40,637 | 35,604 |
| Upstream leased assets | 16,119 | 21,860 | 14,347 |
| Downstream transportation | Not relevant | Not relevant | Not relevant |
| Processing of sold products | Not relevant | Not relevant | Not relevant |
| Use of sold products | 3,544 | 2,936 | 2,751 |
| End-of-life treatment of sold products | 6,278 | 4,065 | 2,581 |
| Downstream leased assets | Not relevant | Not relevant | Not relevant |
| Franchises | Not relevant | Not relevant | Not relevant |
| Investments | 9,205 | 80,643 | 90,327 |
| Total including Location-based | 1,190,159 | 1,616,761 | 1,621,858 |
| Total including Market-based | 1,152,027 | 1,618,238 | 1,597,810 |
| TOTAL EMISSIONS BY ORIGIN - BIOTEST | ||
| Gross T CO2 e | 2023 | 2022 |
| Scope 1 | 18,300 | 12,283 |
| Natural gas | 16,345 | 11,424 |
| Fugitive emissions | 1,638 | 650 |
| Other fuel (gasoline, diesel and propane) | 317 | 209 |
| Scope 2 | 15,464 | 6,523 |
| Electricity (market-based) | 15,464 | 6,523 |
| District heating | - | - |
| Scope 3 | - | - |
| Total | 33,765 | 18,806 |
| Refrigerant gas leaks | |||
| Absolute value (T) | 2023 | 2022 | 2021 |
| HCFC | 0.44 | 0.23 | 0.63 |
| HFC | 3.08 | 4.06 | 15.70 |
| Others | 0.025 | 0.02 | 1.24 |
| Refrigerant gas leaks - Biotest | |
| Absolute value (T) | 2023 |
| HCFC | 0 |
| HFC | 0.73 |
| Others* | 1.63 |
*It includes natural refrigerants: R744 (CO₂) and R290 (Propane)
| Other emissions | |||
| Absolute value (T) | 2023 | 2022 | 2021 |
| NOx | 71.5 | 59.31 | 74.14 |
| CO | 62.7 | 63.65 | 66.04 |
| SO2 | 0.57 | 0.63 | 0.58 |
| NOX EMISSIONS INTENSITY | |||
| T/NOX/million euros | 2023 | 2022 | 2021 |
| Total Grifols | 0.01 | 0.01 | 0.02 |
| CO EMISSIONS INTENSITY | |||
| T/CO/million euros | 2023 | 2022 | 2021 |
| Total Grifols | 0.01 | 0.01 | 0.01 |
| SO2 EMISSIONS INTENSITY | |||
| T/SO2/million euros | 2023 | 2022 | 2021 |
| Total Grifols | 0.00 | 0.00 | 0.00 |
| CO2e EMISSIONS INTENSITY | |||
| T/CO2e/million euros | 2023 | 2022 | 2021 |
| Total Grifols (Location-based) | 195.46 | 283.51 | 328.77 |
| Total Grifols (Market-based) | 189.20 | 283.77 | 323.89 |
| SCOPE 1+2 CO2e EMISSIONS INTENSITY | |||
| T/CO2e/million euros | 2023 | 2022 | 2021 |
| Total Grifols (Location-based) | 39.86 | 35.13 | 60.49 |
| Total Grifols (Market-based) | 33.60 | 35.38 | 55.62 |
| CO2e EMISSIONS RELATED TO TRANSPORTATION* | |||
| 2023 | 2022 | 2021 | |
| CO2 transportation emissions (t CO2) | 214,575 | 279,478 | 218,167 |
| CO2 transportation emissions / sales (t CO2 / M €) | 37.63 | 49.01 | 44.22 |
*Emissions from container transport, employee commuting and business travel have been considered.
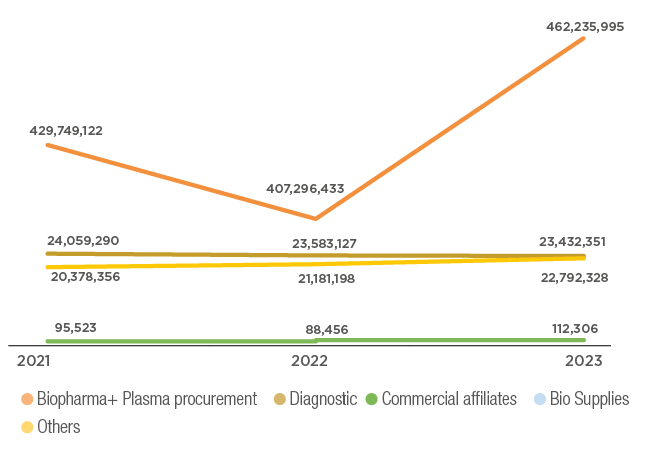
Natural Gas
| BY BUSINESS UNIT | |||
| kWh | 2023 | 2022 | 2021 |
| Biopharma+ Plasma Procurement | 462,235,995 | 407,296,433 | 429,749,122 |
| Diagnostic | 23,432,351 | 23,583,127 | 24,059,290 |
| Others | 22,792,328 | 21,181,198 | 20,378,356 |
| Bio Supplies | 363,976 | 2,989 | 0 |
| Commercial affiliates | 112,306 | 88,456 | 95,523 |
| Total | 508,936,955 | 452,152,203 | 474,282,291 |
| BY BUSINESS UNIT - BIOTEST | ||
| kWh | 2023 | 2022 |
| Plasma Procurement | 3,751,543 | 456,548 |
| Biopharma | 77,568,277 | 50,916,230 |
| Total | 81,319,820 | 51,372,778 |
| BY REGION | |||
| kWh | 2023 | 2022 | 2021 |
| Spain* | 176,029,667 | 143,376,530 | 168,964,411 |
| U.S. | 306,696,892 | 289,704,028 | 280,605,846 |
| RoW | 26,210,396 | 19,071,645 | 24,712,034 |
| Total | 508,936,955 | 452,152,203 | 474,282,291 |
*The consumption of natural gas from the cogeneration plant is included in Spain’s overall totals
| BY COUNTRY - BIOTEST | ||
| kWh | 2023 | 2022 |
| Germany | 78,954,414 | 51,237,535 |
| Spain | 0 | 0 |
| U.S. | 0 | 0 |
| Rest of the World | 3,471,836 | 60,705 |
| Total | 82,426,250 | 51,298,240 |
| VALUE RELATIVE TO SALES | |||
| kWh/millon of euros | 2023 | 2022 | 2021 |
| Biopharma + Plasma Procurement | 91,438 | 87,701 | 112,648 |
| Diagnostic | 34,960 | 35,131 | 30,881 |
| Others | 112,029 | 84,669 | 70,094 |
| Bio Supplies | 2,275 | 20 | 0 |
| Commercial affiliates | - | - | - |
| VALUE RELATIVE TO SALES - BIOTEST | ||
| kWh/millon of euros | 2023 | 2022 |
| Plasma Procurement | 91,114 | 13,602 |
| Biopharma | 176,470 | 166,198 |
| Total | 267,584 | 166,198 |
| VALUE RELATIVE TO PRODUCTION | |||
| kWh/Production index | 2023 | 2022 | 2021 |
| Biopharma + Plasma Procurement* | 8.8 | 9.2 | 10.0 |
| Diagnostic** | 34,960 | 35,131 | 30,881 |
| Others** | 112,029 | 84,669 | 70,094 |
| Bio Supplies** | 2,275 | 20 | - |
| Commercial affiliates | - | - | - |
| Total | 83,585 | 79,287 | 96,143 |
Production index: * Liters of plasma: fractionated + equivalent / ** Sales
| VALUE RELATIVE TO PRODUCTION - BIOTEST | ||
| kWh/Production index | 2023 | 2022 |
| Plasma Procurement* | 6.5 | 1.0 |
| Biopharma** | 42 | 154 |
Production index: * Liters of plasma: fractionated + equivalent / ** Sales
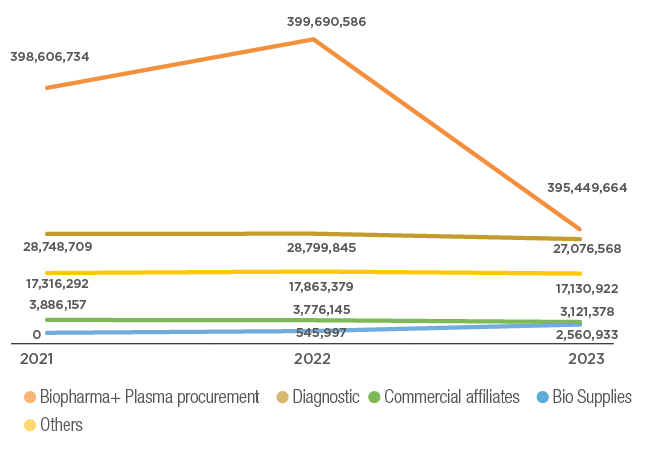
| BY BUSINESS UNIT | |||
| kWh | 2023 | 2022 | 2021 |
| Biopharma+Plasma procurement | 395,449,664 | 399,690,586 | 398,606,734 |
| Diagnostic | 27,076,568 | 28,799,845 | 28,748,709 |
| Bio Supplies | 2,560,933 | 545,997 | 0 |
| Others | 17,130,922 | 17,863,379 | 17,316,292 |
| Commercial affiliates | 3,121,378 | 3,776,145 | 3,886,157 |
| Total | 445,339,465 | 450,675,952 | 448,557,892 |
| BY BUSINESS UNIT - BIOTEST | ||
| kWh | 2023 | 2022 |
| Plasma Procurement | 3,206,163 | 2,074,670 |
| Biopharma | 31,391,544 | 21,388,628 |
| Total | 34,597,707 | 23,463,298 |
| Others | 0 | 400 |
| Total | 34,597,707 | 23,463,698 |
| BY REGION | |||
| kWh | 2023 | 2022 | 2021 |
| Spain | 94,846,417 | 92,681,455 | 93,187,332 |
| U.S. | 312,804,351 | 321,130,633 | 311,469,242 |
| RoW | 37,688,697 | 36,863,865 | 43,901,318 |
| Total | 445,339,465 | 450,675,952 | 448,557,892 |
| BY REGION - BIOTEST | ||
| kWh | 2023 | 2022 |
| Germany | 32,250,734 | 22,279,317 |
| Spain | 0 | 5,186 |
| U.S. | 0 | 0 |
| RoW | 2,301,682 | 1,157,612 |
| Total | 34,552,416 | 23,442,115 |
| VALUE RELATIVE TO SALES | |||
| kWh/million euros | 2023 | 2022 | 2021 |
| Biopharma+Plasma Procurement | 78,226 | 86,063 | 104,485 |
| Diagnostic | 40,396 | 42,902 | 36,900 |
| Bio Supplies | 16,010 | 3,738 | 0 |
| Others | 84,202 | 71,406 | 59,562 |
| Commercial affiliates | - | - | - |
| Total | 73,140 | 79,028 | 90,928 |
| VALUE RELATIVE TO SALES - BIOTEST | ||
| kWh/millon of euros | 2023 | 2022 |
| Plasma Procurement | 77,499 | 61,812 |
| Biopharma | 70,156 | 69,816 |
| Others | 0 | 97 |
| Total | 147,655 | 131,725 |
| VALUE RELATIVE TO PRODUCTION | |||
| kWh/production index | 2023 | 2022 | 2021 |
| Biopharma + Plasma Procurement* | 7.5 | 9.0 | 9.3 |
| Diagnostic** | 40,396 | 42,902 | 36,900 |
| Bio Supplies** | 16,010 | 3,738 | 0 |
| Others** | 84,202 | 71,406 | 59,562 |
| Commercial affiliates | - | - | - |
Production index: * Liters of plasma: fractionated + equivalent / ** Sales
| VALUE RELATIVE TO PRODUCTION - BIOTEST | ||
| kWh/Production index | 2023 | 2022 |
| Plasma Procurement* | 5.6 | 6.3 |
| Biopharma** | 17 | 19 |
Production index: * Liters of plasma: fractionated + equivalent / ** Sales
| RENEWABLE ELECTRIC ENERGY | ||||
| PPA (Power Purchase Agreements) | Guarantees of origin | Own photovoltaic plants | Total | |
| Spain | 20,273,875 | - | 453,471 | 20,727,346 |
| EE.UU. | - | 119,999,113 | - | 119,999,113 |
| Germany | - | 340,000 | - | 398,463 |
| Ireland | - | 11,529,794 | - | 11,529,794 |
| Total | 20,273,875 | 131,868,907 | 453,471 | 152,596,253 |
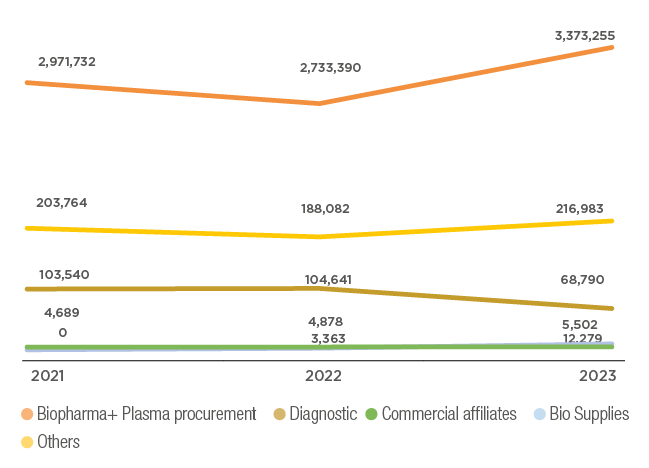
Water cycle
| BY BUSINESS UNIT | |||
| m3 | 2023 | 2022 | 2021 |
| Biopharma+Plasma Procurement | 3,373,254 | 2,733,390 | 2,971,732 |
| Diagnostic | 68,790 | 104,641 | 103,540 |
| Bio Supplies | 12,279 | 3,363 | 0 |
| Others | 216,983 | 188,082 | 203,764 |
| Commercial affiliates | 5,502 | 4,878 | 4,689 |
| Total | 3,676,809 | 3,034,354 | 3,283,725 |
| BY BUSINESS UNIT - BIOTEST | ||
| m3 | 2023 | 2022 |
| Plasma Procurement | 15,549 | 6,610 |
| Biopharma | 474,819 | 333,221 |
| Total | 490,368 | 339,831 |
| Others | - | 400 |
| Total | 490,368 | 340,231 |
| BY REGION | |||
| m3 | 2023 | 2022 | 2021 |
| Spain | 961,208 | 884,304 | 866,181 |
| U.S. | 2,456,863 | 2,039,650 | 2,249,826 |
| RoW | 258,738 | 113,575 | 167,718 |
| Total | 3,676,809 | 3,037,529 | 3,283,725 |
| BY REGION - BIOTEST | ||
| m3 | 2023 | 2022 |
| Germany | 476,956 | 333,317 |
| Spain | 0 | 0 |
| U.S. | 0 | 0 |
| RoW | 12,646 | 6,447 |
| Total | 489,602 | 339,764 |
| VALUE RELATIVE TO SALES | |||
| m3/million euros | 2023 | 2022 | 2021 |
| Biopharma+Plasma Procurement | 667 | 589 | 779 |
| Diagnostic | 103 | 156 | 133 |
| Bio Supplies | 77 | 23 | 0 |
| Others | 1,067 | 752 | 701 |
| Commercial affiliates | - | - | - |
| Total | 604 | 532 | 666 |
| VALUE RELATIVE TO SALES - BIOTEST | ||
| m3/millIon euros | 2023 | 2022 |
| Plasma Procurement | 368 | 197 |
| Biopharma | 1,065 | 1,088 |
| Others | 0 | 97 |
| Total | 1,433 | 1,382 |
| VALUE RELATIVE TO PRODUCTION | |||
| m3/production index | 2023 | 2022 | 2021 |
| Biopharma+Plasma Procurement* | 0.064 | 0.062 | 0.069 |
| Diagnostic** | 103 | 156 | 133 |
| Bio Supplies** | 77 | 23 | 0 |
| Others** | 1067 | 752 | 701 |
| Commercial affiliates | - | - | - |
Production index: * Liters of plasma: fractionated + equivalent / ** Sales
| VALUE RELATIVE TO PRODUCTION - BIOTEST | ||
| m3/production index | 2023 | 2022 |
| Plasma Procurement* | 368 | 0 |
| Biopharma** | 1,065 | 1 |
Production index: * Liters of plasma: fractionated + equivalent / ** Sales
| BY SOURCE AND WATER STRESSED REGIONS - 2023 | ||||
| Water consumption (m3) | Total | By source | % of consumption in water-stressed regions* | |
| Groundwater | Third party water | |||
| Biopharma + Plasma Procurement | 3,373,255 | 262,471 | 3,110,784 | 19.1 |
| Diagnostic | 68,790 | 0 | 68,790 | 17.8 |
| Bio Supplies | 12,279 | 0 | 12,279 | 54.8 |
| Others | 216,983 | 130,386 | 86,597 | 34.9 |
| Commercial affiliates | 5,502 | 0 | 5,502 | 28.8 |
| Total | 3,676,809 | 392,857 | 3,283,952 | 20.1 |
*Areas with high and extremely high risk according to World Resources Institute
| BY SOURCE AND WATER STRESSED REGIONS - 2022 | ||||
| Water consumption (m3) | Total | By source | % of consumption in water-stressed regions* | |
| Groundwater | Third party water | |||
| Biopharma + Plasma Procurement | 2,733,390 | 234,824 | 2,498,566 | 19.3 |
| Diagnostic | 104,641 | 0 | 104,641 | 24.7 |
| Bio Supplies | 3,363 | 0 | 3,363 | 100.0 |
| Others | 188,082 | 120,943 | 67,139 | 26.4 |
| Commercial affiliates | 4,878 | 0 | 4,878 | 41.0 |
| Total | 3,034,354 | 355,767 | 2,678,588 | 20.0 |
*Areas with high and extremely high risk according to World Resources Institute
| BY SOURCE AND WATER STRESSED REGIONS - 2021 | ||||
| Water consumption (m3) | Total | By source | % of consumption in water-stressed regions* | |
| Groundwater | Third party water | |||
| Biopharma + Plasma Procurement | 2,971,732 | 217,785 | 2,753,947 | 18.9 |
| Diagnostic | 103,540 | 0 | 103,540 | 71.5 |
| Bio Supplies | 0 | 0 | 0 | 0.0 |
| Others | 203,764 | 115,989 | 87,775 | 0.2 |
| Commercial affiliates | 4,689 | 0 | 4,689 | 5.8 |
| Total | 3,283,725 | 333,774 | 2,949,951 | 19.4 |
*Areas with high and extremely high risk according to World Resources Institute
| BY SOURCE AND WATER STRESSED REGIONS - BIOTEST - 2023 | ||||
| Water consumption (m3) | Total | By source | % of consumption in water-stressed regions* | |
| Groundwater | Third party water | |||
| Plasma Procurement | 15,896 | 0 | 15,896 | 0.0% |
| Biopharma | 473,706 | 0 | 473,706 | 0.0% |
| Others | 0 | 0 | 0.0% | |
| Total | 489,602 | 0 | 489,602 | 0.0% |
*Areas with high and extremely high risk according to World Resources Institute
| BY SOURCE AND WATER STRESSED REGIONS - BIOTEST - 2022 | ||||
| Water consumption (m3) | Total | By source | % of consumption in water-stressed regions* | |
| Groundwater | Third party water | |||
| Plasma Procurement | 15,896 | 0 | 15,896 | 0.0% |
| Biopharma | 473,706 | 0 | 473,706 | 0.0% |
| Others | 0 | 0 | 0.0% | |
| Total | 489,602 | 0 | 489,602 | 0.0% |
*Areas with high and extremely high risk according to World Resources Institute
| WASTEWATER DISCHARGE BY SOURCE AND STRESS AREAS - 2023 | ||||
| Water discharged (m3) | By destination | By treatment | By region | |
| Total (public sewer system) | No internal treatment* | Biological systems prior to discharge** | % of discharged on water-stressed regions*** | |
| Biopharma+Plasma Procurement | 2,228,746 | 1,379,555 | 849,191 | 17.5 |
| Diagnostic | 37,799 | 37,799 | 0 | 32.3 |
| Bio Supplies | 12,277 | 12,277 | 0 | 54.8 |
| Others | 144,005 | 144,005 | 0 | 27.8 |
| Commercial affiliates | 4,696 | 4,696 | 0 | 43.4 |
| Total | 2,427,523 | 1,578,332 | 849,191 | 18.6 |
* Wastewater discharged into the sewer system with subsequent treatment of municipal services
** Internal pretreatment processes
*** Areas with high and extremely high risk according to World Resources Institute”
| WASTEWATER DISCHARGE BY SOURCE AND STRESS AREAS - 2022 | ||||
| Water discharged (m3) | By destination | By treatment | By region | |
| Total (public sewer system) | No internal treatment* | Biological systems prior to discharge** | % of discharged on water-stressed regions*** | |
| Biopharma+Plasma Procurement | 2,081,495 | 1,207,603 | 873,892 | 16.6 |
| Diagnostic | 90,680 | 90,680 | 0 | 24.4 |
| Bio Supplies | 3,363 | 3.363 | 0 | 100.0 |
| Others | 152,252 | 152,252 | 0 | 6.2 |
| Commercial affiliates | 4,875 | 4,875 | 0 | 41.0 |
| Total | 2,332,665 | 1,458,773 | 873,892 | 17.8 |
* Wastewater discharged into the sewer system with subsequent treatment of municipal services
** Internal pretreatment processes
*** Areas with high and extremely high risk according to World Resources Institute”
| WASTEWATER DISCHARGE BY SOURCE AND STRESS AREAS - 2021 | ||||
| Water discharged (m3) | By destination | By treatment | By region | |
| Total (public sewer system) | No internal treatment* | Biological systems prior to discharge** | % of discharged on water-stressed regions*** | |
| Biopharma+Plasma Procurement | 2,200,395 | 1,313,460 | 886,935 | 23.3 |
| Diagnostic | 88,043 | 88,043 | 0 | 67.9 |
| Bio Supplies | 0 | 0 | 0 | 0.0 |
| Others | 141,364 | 141,364 | 0 | 0.3 |
| Commercial affiliates | 4,687 | 4,687 | 0 | 6.0 |
| Total | 2,434,489 | 1,547,554 | 886,935 | 23.6 |
* Wastewater discharged into the sewer system with subsequent treatment of municipal services
** Internal pretreatment processes
*** Areas with high and extremely high risk according to World Resources Institute”
| WASTEWATER DISCHARGE BY SOURCE AND STRESS AREAS - BIOTEST - 2023 | ||||
| Water discharged (m3) | By destination | By treatment | By region | |
| Total (public sewer system) | No internal treatment* | Biological systems prior to discharge** | % of discharged on water-stressed regions*** | |
| Plasma Procurement | 15,896 | 15,896 | 0 | 0.0% |
| Biopharma | 430,754 | 430,754 | 0 | 0.0% |
| Others | 0 | 0 | 0 | 0.0% |
| Total | 446,650 | 446,650 | 0 | 0.0% |
* Wastewater discharged into the sewer system with subsequent treatment of municipal services
** Internal pretreatment processes
*** Areas with high and extremely high risk according to World Resources Institute
| WASTEWATER DISCHARGE BY SOURCE AND STRESS AREAS - BIOTEST - 2022 | ||||
| Water discharged (m3) | By destination | By treatment | By region | |
| Total (public sewer system) | No internal treatment* | Biological systems prior to discharge** | % of discharged on water-stressed regions*** | |
| Plasma Procurement | 15,896 | 15,896 | 0 | 0.0% |
| Biopharma | 430,754 | 430,754 | 0 | 0.0% |
| Others | 0 | 0 | 0 | 0.0% |
| Total | 446,650 | 446,650 | 0 | 0.0% |
* Wastewater discharged into the sewer system with subsequent treatment of municipal services
** Internal pretreatment processes
*** Areas with high and extremely high risk according to World Resources Institute
| SUSPENDED SOLIDS DISCHARGED | |||
| 2023 | 2022 | 2021 | |
| Total (T) | 326 | 357 | 428 |
| Relative to sales (T/million euros) | 0.053 | 0.06 | 0.09 |
| COD DISCHARGED | |||
| 2023 | 2022 | 2021 | |
| Total (T) | 2,168 | 2,525 | 2,731 |
| Relative to sales (T/million euros) | 0.36 | 0.44 | 0.55 |
| TOTAL ENERGY CONSUMPTION | |||
| kWh | 2023 | 2022 | 2021 |
| Biopharma+Plasma Procurement | 831,629,897 | 794,588,340 | 802,753,813 |
| Diagnostic | 50,553,569 | 52,435,934 | 53,238,663 |
| Bio Supplies | 2,925,893 | 549,477 | 0 |
| Others | 39,970,526 | 39,044,577 | 37,440,087 |
| Commercial affiliates | 3,679,067 | 3,871,545 | 4,015,725 |
| Total | 928,758,952 | 890,489,873 | 897,448,288 |
| TOTAL ENERGY CONSUMPTION - BIOTEST | ||
| kWh | 2023 | 2022 |
| Plasma Procurement | 6,957,706 | 2,572,197 |
| Biopharma | 109,255,786 | 72,897,207 |
| Others | 0 | 0 |
| Total | 116,213,492 | 75,469,404 |
| CONSUMPTION VALUE RELATIVE TO SALES | |||
| kWh | 2023 | 2022 | 2021 |
| Biopharma + Plasma Procurement | 164,510 | 171,095 | 210,421 |
| Diagnostic | 75,423 | 78,112 | 68,333 |
| Bio Supplies | 18,292 | 3,762 | 0 |
| Others | 196,463 | 156,075 | 128,780 |
| Commercial affiliates | - | - | - |
| Total | 152,534 | 156,152 | 181,923 |
| CONSUMPTION VALUE RELATIVE TO SALES | ||
| kWh/million euros | 2023 | 2022 |
| Plasma Procurement | 168,628 | 76,635 |
| Biopharma | 247,290 | 237,947 |
| Others | 0 | 0 |
| Total | 415,918 | 314,582 |
| COGENERATION PLANT | |||
| kWh | 2023 | 2022 | 2021 |
| Natural gas consumed (kwh) | 110,159,693 | 75,119,463 | 114,018,162 |
| Total electricity generate (kwh) | 40,656,130 | 27,618,042 | 41,712,040 |
| Useful heat recoverd (kwh) | 30,387,110 | 20,623,619 | 30,857,670 |
| COGENERATION PLANT - BIOTEST | ||
| kWh | 2023 | 2022 |
| Natural gas consumed (kwh) | 17,440,542 | 13,199,091 |
| Total electricity generate (kwh) | 5,958,345 | 4,770,118 |
| Useful heat recoverd (kwh) | 9,174,840 | 6,759,322 |
Emissions savings have been calculated following the basis of the European Union Emission Trading Scheme EU ETS.
Waste management
| GENERATED WASTE BY TYPE AND DISPOSAL METHOD ABSOLUTE VALUE | |||||
| T | Treatment | 2023 | 2022 | 2021 | |
| Waste diverted from disposal | Hazardous waste | Energy recovered and by-products | 722 | 673 | 579 |
| Reused | 2 | 70 | 65 | ||
| Recycled | 1,317 | 1,100 | 2,509 | ||
| Non-hazardous waste | Energy recovered and by-products | 6,721 | 5,551 | 5,587 | |
| Reused | 256 | 231 | 258 | ||
| Recycled | 12,614 | 12,930 | 13,376 | ||
| Composted | 3,847 | 2195 | 1,882 | ||
| Waste directed to disposal | Hazardous waste | Incineration (with energy recovery) | 470 | 336 | 244 |
| Incineration (withou energy recovery) | 50 | 609 | 19 | ||
| Landfill disposal | 0 | 0 | 0 | ||
| Other disposal treaments | 6,586 | 7053 | 5,416 | ||
| Non-hazardous waste | Incineration (with energy recovery) | 11 | 0 | 12 | |
| Incineration (withou energy recovery) | 21 | 16 | 18 | ||
| Landfill disposal | 17,674 | 13,097 | 14,129 | ||
| Other disposal treaments | 827 | 1,091 | 855 | ||
| Total | 51,119 | 44,954 | 44,949 | ||
| GENERATED WASTE BY TYPE AND DISPOSAL METHOD ABSOLUTE VALUE - biotest | ||||
| T | Treatment | 2023 | 2022 | |
| Waste diverted from disposal | Hazardous waste | Energy recovered and by-products | 0 | 84 |
| Reused | 0 | 0 | ||
| Recycled | 0 | 0 | ||
| Non-hazardous waste | Energy recovered and by-products | 0 | 36 | |
| Reused | 0 | 0 | ||
| Recycled | 0 | 1 | ||
| Composted | 0 | 0 | ||
| Waste directed to disposal | Hazardous waste | Incineration (with energy recovery) | 399 | 17 |
| Incineration (withou energy recovery) | 9,340 | 19 | ||
| Landfill disposal | 28 | 1 | ||
| Other disposal treaments | 0,0 | 5,397 | ||
| Non-hazardous waste | Incineration (with energy recovery) | 1,269 | 657 | |
| Incineration (withou energy recovery) | 443 | 99 | ||
| Landfill disposal | 0 | 46 | ||
| Other disposal treaments | 0 | 251 | ||
| Total | 11,554 | 6,608 | ||
| GENERATED WASTE BY TYPE AND DISPOSAL METHOD RELATIVE VALUE | |||||
| T/million euros | Treatment | 2023 | 2022 | 2021 | |
| Waste diverted from disposal | Hazardous waste | Energy recovered and by-products | 0.12 | 0.12 | 0.12 |
| Reused | 0.00 | 0.01 | 0.01 | ||
| Recycled | 0.22 | 0.02 | 0.51 | ||
| Non-hazardous waste | Energy recovered and by-products | 1.10 | 0.97 | 1.13 | |
| Reused | 0.04 | 0.04 | 0.05 | ||
| Recycled | 2.07 | 2.27 | 2.71 | ||
| Composted | 0.63 | 0.39 | 0.38 | ||
| Waste directed to disposal | Hazardous waste | Incineration (with energy recovery) | 0.08 | 0.06 | 0.05 |
| Incineration (withou energy recovery) | 0.01 | 0.11 | 0.00 | ||
| Landfill disposal | 0.00 | 0.00 | 0.00 | ||
| Other disposal treaments | 1.08 | 1.24 | 1.10 | ||
| Non-hazardous waste | Incineration (with energy recovery) | 0.00 | 0.00 | 0.00 | |
| Incineration (withou energy recovery) | 0.00 | 0.00 | 0.00 | ||
| Landfill disposal | 2.90 | 2.30 | 2.86 | ||
| Other disposal treaments | 0.14 | 0.19 | 0.17 | ||
| Total | 8.40 | 7.88 | 9.11 | ||
| GENERATED WASTE BY TYPE AND DISPOSAL METHOD RELATIVE VALUE - biotest | ||||
| T/million euros | Treatment | 2023 | 2022 | |
| Waste diverted from disposal | Hazardous waste | Energy recovered and by-products | 0.00 | 0.12 |
| Reused | 0.00 | 0.01 | ||
| Recycled | 0.00 | 0.19 | ||
| Non-hazardous waste | Energy recovered and by-products | 0.00 | 0.97 | |
| Reused | 0.00 | 0.04 | ||
| Recycled | 0.00 | 2.27 | ||
| Composted | 0.00 | 0.39 | ||
| Waste directed to disposal | Hazardous waste | Incineration (with energy recovery) | 0.01 | 0.06 |
| Incineration (withou energy recovery) | 0.29 | 0.11 | ||
| Landfill disposal | 0.00 | 0.00 | ||
| Other disposal treaments | 0.00 | 1.24 | ||
| Non-hazardous waste | Incineration (with energy recovery) | 0.04 | 0.00 | |
| Incineration (withou energy recovery) | 0.01 | 0.00 | ||
| Landfill disposal | 0.00 | 2.30 | ||
| Other disposal treaments | 0.00 | 0.19 | ||
| Total | 0.36 | 7.89 | ||
| ABSOLUTE VALUE BY BUSINESS UNIT | |||
| T | 2023 | 2022 | 2021 |
| Biopharma+Plasma Procurement | 47,817 | 42,077 | 41,868 |
| Diagnostic | 1,322 | 1,143 | 1,035 |
| Bio Supplies | 358 | 99 | - |
| Others | 1,400 | 1,305 | 1,720 |
| Commercial affiliates | 222 | 330 | 327 |
| Total | 51,119 | 44,954 | 44,949 |
| ABSOLUTE VALUE BY BUSINESS UNIT - BIOTEST | ||
| T | 2023 | 2022 |
| Plasma Procurement | 586 | 181 |
| Biopharma | 10,823 | 6,325 |
| Total | 11,409 | 6,506 |
| ABSOLUTE VALUE BY REGION | |||
| m3 | 2023 | 2022 | 2021 |
| Spain | 5,759 | 5,287 | 5,702 |
| U.S. | 42,757 | 37,784 | 37,577 |
| RoW | 2,603 | 1,883 | 1,669 |
| Total | 51,119 | 44,954 | 44,949 |
| ABSOLUTE VALUE BY REGION - biotest | ||
| m3 | 2023 | 2022 |
| Germany | 10,936 | 6,385 |
| Spain | 0 | 0 |
| U.S. | 0 | 0 |
| Rest of the world | 473 | 222 |
| Total | 11,409 | 6,607 |
Main materials consumed
| MAIN MATERIALS CONSUMED - BIOPHARMA | |||
| Absolute value (T) | 2023 | 2022 | 2021 |
| Sorbitol | 1,400 | 1,164 | 1,163 |
| Ethanol | 2,652 | 3,225 | 2,730 |
| Polyethylene glycol | 2,318 | 1,720 | 1,749 |
| Glass packaging | 3,441 | 2,881 | 2,750 |
| Total | 9,811 | 8,990 | 8,392 |
| MAIN MATERIALS CONSUMED - BIOPHARMA - biotest | ||
| Absolute value (T) | 2023 | 2022 |
| Sorbitol | 0.00 | 0.00 |
| Ethanol | 2,506 | 1,462 |
| Polyethylene glycol | 0.00 | 0.00 |
| Glass packaging | 284 | 218 |
| Total | 2,790 | 1,680 |
| MAIN MATERIALS CONSUMED - DIAGNOSTIC | |||
| Absolute value (T) | 2023 | 2022 | 2021 |
| Circuit boards (units) | 20,890 | 27,463 | 40,344 |
| PP Plastic Cards | 363 | 300 | 279 |
| Glass packaging | 60 | 21 | 28 |
| Plastic reagent packaging* | 50,827 | 30 | 21 |
| Red cell reagents (liters)** | 0 | 266,803 | 275,435 |
| PVC pellets, flat tubes and sheets | 0 | 14 | 121 |
*Plastic containers from the San Diego plant have been added to the calculation
**The data taken into account in previous years corresponds to production and not to purchasing. Therefore, it is no longer considered for calculation in 2023.
| MAIN MATERIALS CONSUMED - OTHERS | |||
| Absolute value (T) | 2023 | 2022 | 2021 |
| PP | 1,067 | 979 | 832 |
| Glucose | 112 | 185 | 148 |
| Sodium chloride | 281 | 210 | 208 |
| Glass packaging | 350 | 526 | 238 |
| Total | 1,810 | 1,900 | 1,426 |